| Issue |
EPJ Appl. Metamat.
Volume 13, 2026
Special Issue on 'Metamaterials for Novel Wave Phenomena: Theory, Design and Application in Microwaves', edited by Sander Mann and Stefano Vellucci
|
|
|---|---|---|
| Article Number | 10 | |
| Number of page(s) | 10 | |
| DOI | https://doi.org/10.1051/epjam/2026002 | |
| Published online | 04 March 2026 | |
https://doi.org/10.1051/epjam/2026002
Original Article
HoFeO3 with Thermo-Softened phonons for 3D-printed terahertz metamaterials
1
School of Mechanical Engineering, University of Science and Technology Beijing, Beijing 100083, PR China
2
State Key Laboratory of New Ceramic Materials, School of Materials Science and Engineering, Tsinghua University, Beijing 100084, PR China
3
Institute of Materials Research, Tsinghua Shenzhen International Graduate School, Tsinghua University, Shenzhen 518055, PR China
4
State Key Laboratory for Advanced Metals and Materials, University of Science and Technology Beijing, Beijing 100083, PR China
5
The Ninth Research Institute of China Electronics Technology Group Corporation, Mianyang 621000, PR China
6
Foshan (Southern China) Institute for New Materials, Foshan 528247, PR China
7
School of Electronic Information Engineering, Inner Mongolia University, Hohhot 010021, PR China
* e-mail: This email address is being protected from spambots. You need JavaScript enabled to view it.
** e-mail: This email address is being protected from spambots. You need JavaScript enabled to view it.
*** e-mail: This email address is being protected from spambots. You need JavaScript enabled to view it.
Received:
29
November
2025
Accepted:
21
January
2026
Published online: 4 March 2026
Abstract
HoFeO3 rare earth ferrite exhibits distinctive crystallographic properties; however, its regulatory mechanisms and methods within the terahertz band remain complex. This study employed variable-temperature Raman spectroscopy to explore atomic interactions within the crystal structures of HoFeO3 across various modes, spanning temperatures from 20 to 300 K. The fabrication of HoFeO3 metamaterials was achieved using 3D direct ink writing additive manufacturing technology, accompanied by the design of a three-coordinate spatial intelligent control structure to manipulate terahertz electromagnetic waves. Variable-temperature Raman spectroscopy revealed twelve active peaks, which included the stretching vibrations of Ho and O, the torsion of FeO6, and the stretching vibrations of Fe-O. Notably, these phonons exhibited softening phenomena with increasing temperature. A low transmittance (transmittance <0.1) of terahertz waves at 0.82 THz was attained through the use of 3D-printed double-layer 90° metamaterials. Furthermore, when the double-layer 45° metamaterials were rotated in the E-H plane around the propagation direction as the central axis, the terahertz waves demonstrated a rotational symmetry transmission law at 0.5 THz. This research offers effective materials and construction methods for metamaterials aimed at regulating terahertz electromagnetic waves.
Key words: Additive manufacturing / Metamaterials / HoFeO3 / Terahertz response / Variable-temperature Raman spectroscopy
© X. Zeng et al., Published by EDP Sciences, 2026
 This is an Open Access article distributed under the terms of the Creative Commons Attribution License (https://creativecommons.org/licenses/by/4.0), which permits unrestricted use, distribution, and reproduction in any medium, provided the original work is properly cited.
1 Introduction
Rare earth orthoferrites not only exhibit distinctive lattice dynamic properties but also serve as materials for the development of terahertz wave control devices [1–5]. Significant advancements have been made in understanding the interactions between atoms within the crystal structures of these materials and their regulatory behavior concerning terahertz waves [6–10]. A research team from the Luxembourg Institute of Technology investigated the lattice vibration characteristics of six rare earth normal ferrites using room-temperature polarized Raman scattering and first-principles calculations [11]. Anhua et al. systematically explored the mechanisms for achieving terahertz optical control in rare earth orthoferrite crystals, focusing on spin reorientation induced by ultrafast optical pulses and the modulation of magnon resonance through element doping [12].
Currently, most research emphasizes material preparation and the characterization of performance at room temperature [13]. However, there is a notable deficiency in the systematic investigation of crystal structure evolution below 300 K, which hampers the understanding of lattice distortion and atomic vibration modes in low-temperature environments. Additionally, transmission control methods in the terahertz band are often complex, typically depending on external fields, such as temperature [14,15] and magnetic fields [16,17], or on component doping [18,19], which restricts the freedom of structural design. Although 3D direct ink writing additive manufacturing technology enables the structured design of terahertz devices [20,21], the additive manufacturing process for HoFeO3 and the terahertz response of structured samples remain inadequate [22].
In response to the aforementioned issues, this study examined the interactions among atoms within the crystal structures of HoFeO3 ceramics across various modes at temperatures ranging from 20 K to 300 K, utilizing variable-temperature Raman spectroscopy. Double-layer structured HoFeO3 metamaterial samples were fabricated through direct writing additive manufacturing technology, and a three-coordinate spatial intelligent control structure was developed to modulate the terahertz electromagnetic response of the HoFeO3 metamaterial. The results of the variable-temperature Raman experiments revealed 12 active peaks, which included the vibrations of Ho, the torsion of FeO6, and the stretching vibrations of Fe-O, among others. The designed structured samples demonstrated a stable low transmission region (transmittance < 0.1) within the terahertz band, with the modulation effect closely linked to the variations in structure and angle. This research facilitates the device integration of HoFeO3 ceramic-based terahertz regulation.
2 Experimental methods
In this experiment, HoFeO3 ceramics were synthesized using the solid-state reaction method [23–25]. Five temperature gradients were established: 1400°C, 1450°C, 1475°C, 1500°C, and 1525°C. Following sintering, the surface morphology was examined via scanning electron microscopy (SEM) to determine the optimal temperature [26]. Prior to SEM analysis, pure gold films were deposited using an ion sputtering gold spraying instrument. During observation, macroscopic defects were first scanned at low magnification, followed by high magnification to capture noise-free, undistorted images. When switching samples, focus and contrast were adjusted in real time to clearly reveal the details of grains and pores.
Variable-temperature Raman spectroscopy testing involves selecting a suitable vacuum cover and securely sealing it. The desired temperature is then set using the temperature controller. Once the temperature stabilizes, the test should be repeated four times at each temperature point. The average of the collected data will serve as the final result for that temperature, thereby ensuring reliability and repeatability.
3D direct ink writing additive manufacturing: This study utilizes a self-constructed 3D ink direct writing printing system to achieve micron-level forming accuracy and stable extrusion control. The system features a printing stroke range of 300 mm × 300 mm × 100 mm. Initially, the Polyvinyl Alcohol (PVA) solution is prepared. The prepared PVA solution is then added to the powder and stirred thoroughly. Following this, vacuum deaeration is performed. The mixed ink is transferred to the vacuum deaerator for deaeration and set aside for later use. The printing parameters were as follows: the PVA solution concentration was 10%, the slurry concentration was 50%, the printing speed was 10 mm/s, the nozzle diameter was 100 μm, and the layer height was 80 μm. After printing, the sample is placed in an oven for drying to eliminate residual solvents. Subsequently, the dried body is transferred to a muffle furnace for degreasing, ensuring that the PVA is fully decomposed and removed. After the degreasing process, the muffle furnace is allowed to cool naturally to room temperature. The sample is then retrieved and placed back into the muffle furnace according to the optimal normal burning system for high-temperature sintering. Finally, the sample is cooled with the furnace to room temperature to yield the finished product.
In this experiment, the Zomega Terahertz time-domain spectroscopy (Thz-TDS) system was employed to collect data at 25.5 °C and standard atmospheric pressure. The corresponding frequency domain spectra were subsequently derived using the fast Fourier transform.
3 Results and discussions
Figures 1a and 1b illustrate the direct write printing process. Figure 1c depicts a double-layer structure with an angle of 90 degrees, while Figure 1d presents a double-layer structure with an angle of 60 degrees. Both results exhibit highly uniform lines. The parameters of the printed structure are as follows: the line width is approximately 100 μm, the strand spacing is about 100 μm, the layer height is 80 μm, and the overall dimensions measure 100 ×100 mm. Furthermore, the lines are smooth, exhibiting no breaks or voids along their lengths.
Figure 2 illustrates the electron microstructure of HoFeO3 ceramics subjected to sintering at various temperatures. Figures 2a–2c present the results of the sintering experiments. The microstructure of the ceramics consistently demonstrates a reduction in porosity and an increase in grain growth as the sintering temperature escalates. Notably, there are marked differences in the temperatures at which distinct components achieve their optimal structures. The characteristics of structural evolution in HoFeO3 ceramics are as follows: At a low sintering temperature of 1475 °C, the ceramics display a loose structure characterized by numerous pores, fine grains, and indistinct boundaries. Upon increasing the temperature to 1500 °C, there is a significant reduction in the number of pores, a decrease in average pore size, gradual grain growth, and the beginnings of clearer grain boundary profiles. When the temperature reaches 1525 °C, the voids at the intersections of three grains in the HoFeO3 ceramic are entirely filled, with both pore size and quantity meeting ideal standards. The average grain size markedly increases and becomes uniformly distributed, leading to enhanced structural uniformity. Concurrently, no secondary phase precipitation occurs at the grain boundaries, indicating that the material's sintering state is optimal at this temperature [27].
Variable-temperature Raman testing was conducted using a vacuum hood selected according to the dimensions of the HoFeO3 ceramic wafer. After installing and sealing the vacuum cover, the vacuum pump was activated to establish a vacuum, followed by the activation of the water-cooled liquid nitrogen cooler. The target temperature was set via the temperature controller. Once thermal stabilization was achieved, the Raman test was performed. Each target temperature point underwent four repetitions of the test. The average spectral data was calculated as the final result for each temperature, ensuring reliability and repeatability. The specific data are presented in Figure 3, which indicates that only 12 distinct Raman peaks were observed during the experiment. These peaks correspond to the stretching vibrations of Ho and O, the torsional modes of FeO6, and the stretching vibrations of Fe-O, among others. Figures 4–6 illustrate the Raman spectral correlation results for selected Raman peaks of HoFeO3 ceramics at varying temperatures. Notably, as the temperature increases, a softening phenomenon is observed in these phonons.
The Raman shifts depicted in Figures 4a and 4d exhibit a redshift with increasing temperature. This phenomenon arises from the thermal expansion of the lattice, which elongates the bond lengths between Ho ions and the surrounding oxygen atoms, resulting in a corresponding decrease in vibration frequency [28]. The Raman intensities illustrated in Figure 4b and 4e show a marked increase after 200 K, likely attributable to a reduction in lattice distortion that enhances Raman scattering efficiency. The irregular fluctuations in half-height width presented in Figure 4c and 4f indicate the disorder and non-harmonic characteristics of thermal vibrations, which are influenced by the substantial mass of Ho ions [29].
All modes depicted in Figure 5a, 5d, and 5g demonstrate a trend in which the central value redshifts with increasing temperature. This phenomenon primarily arises from the weakening of the bond force constant due to thermal expansion, leading to a reduction in vibration frequency [30,31]. The intensities illustrated in Figure 5b, 5e, and 5h exhibit fluctuations in the low-temperature region, followed by a significant increase. This increase may result from the enhanced tilt angle of the FeO6 octahedron, which markedly boosts the Raman activity in the rotational mode, thereby elevating the intensity [32]. The half-height width results presented in Figure 5c, 5f, and 5i reveal multiple peaks in the low-temperature region, indicating lattice disorder.
The Raman displacements, with Fe-O as the primary displacement mode, depicted in Figure 6a, 6d, 6g, and 6j, exhibit an overall redshift with increasing temperature. This observation aligns with the principle that thermal expansion results in longer bond lengths and reduced bond strength. As illustrated in Figure 6b, 6e, 6h, and 6k, the Raman intensity reaches a maximum near 220 K before exhibiting a downward trend. This peak corresponds to the combined influences of spin-phonon coupling and lattice softening. The peak widths presented in Figure 6f, 6i, and 6l show significant fluctuations within the 100–150 K range, which may indicate local lattice distortion. The findings in Figures 4–6 show no abrupt appearances or disappearances of Raman peaks during the testing process, suggesting that the HoFeO3 ceramic maintains a stable structure across temperatures from 20 K to 300 K [33,34].
THz-TDS test: In this experiment, the THz-TDS system developed by Zomega Terahertz was utilized to collect terahertz signals at 25.5°C and standard atmospheric pressure. Following the completion of all preparatory work, a reference measurement was conducted without samples. Subsequently, the sample was positioned appropriately on the sample stage, and its initial position was recorded before initiating the measurement and saving the data. The sample stage was then rotated to the specified angle, allowing for the next measurement step. An angular step of 10° was selected to achieve a balance between data accuracy and acquisition time. Figure 7 illustrates three sample stages that rotate around different axes. As shown in Figure 7a, 7e, and 7i, the sample stage is precisely controlled by a microcontroller which drives servo motors. Through gear transmission, the sample is rotated around the X, Y, and Z axes. This enables the adjustment of the incident angle of terahertz radiation relative to the structural components and achieves full-range rotational control in three-dimensional space. Finally, the frequency-domain spectrum corresponding to the time-domain spectrum was obtained using the fast Fourier transform method. The results of the rotation angle and frequency domain, derived from the terahertz wave modulation in different rotation directions within the double-layer HoFeO3 ceramic structure, are presented in Figure 7, while the processed data results are shown in Figures 8 and 9.
The results presented in Figure 7c and 7g indicate that, when rotating in a positive direction along the axes depicted in Figure 7a and 7e, the overall transmittance decreases as the absolute value of the rotation angle increases [35,36]. Based on the motion trajectory of the electric field vector of electromagnetic waves, these waves are categorized into vertically polarized (TE, transverse electric) waves and horizontally polarized (TM, transverse magnetic) waves [37,38]. When electromagnetic waves impinge upon the surface of materials, both reflection and transmission phenomena occur. For oblique incidence of electromagnetic waves from air onto a non-magnetic medium, the transmission coefficients T⊥ and T|| are expressed as
 (1)
(1)
 (2)
(2)
θi is the incident angle of the electromagnetic wave, and εr is the relative permittivity of the material [39].
Formula (1) represents a monotonically decreasing function over the interval from 0° to 90°, whereas Formula (2) initially increases monotonically before decreasing from 0° to 90°. Based on the initial positions and rotation directions illustrated in Figure 7b and 7f, along with the frequency-domain results presented in Figure 7c and 7g, it is evident that when rotation occurs in the positive direction, the overall transmittance diminishes as the absolute value of the rotation angle increases. This phenomenon can be elucidated through the polarization characteristics of electromagnetic waves and the theory of interface transmission. Electromagnetic waves are categorized into TE (transverse electric, or vertically polarized) and TM (transverse magnetic, or horizontally polarized) waves. When electromagnetic waves are incident obliquely on a non-magnetic medium, the transmission coefficient for TE waves, denoted as T⊥ (Formula 1), decreases monotonically from 0° to 90°, which primarily accounts for the overall reduction in transmission during rotation. The TM wave transmission coefficient T|| (Formula 2) initially increases before subsequently decreasing [40]. Although it does not dictate the overall trend, it influences subtle variations in transmittance within a specific angular range, resulting in a non-linear decline in transmittance and the potential for local fluctuations. As illustrated in Figure 7, the transmittance of all structures in the low-frequency band remains relatively high, with similar fluctuation patterns observed. As frequency increases, transmittance decreases. The rotation direction depicted in Figure 7b exerts a more significant effect on transmittance compared to the directions shown in Figure 7f and 7j. A detailed numerical analysis of select frequency bands is presented in Figures 8 and 9.
As illustrated in Figure 8, the overall symmetry of the double-layer 90-degree structure is relatively robust, with transmittance values remaining consistent when the absolute values of the rotation angles are equivalent. However, at 0.26 THz, the difference between the maximum and minimum transmittance values depicted in Figure 8a is 0.43. In contrast, the differences in maximum and minimum transmittance values for Figures 8 8b and 8c are 0.06 and 0.23, respectively. This trend persists at 0.5 THz, where the transmittance difference in Figure 8d is 0.31, while Figures 8e and 8f exhibit differences of 0.23 and 0.07, respectively. These observations indicate that the rotation direction and angle presented in Figure 7b significantly influence the control of terahertz waves. The contour plot results in Figures 8g, 8j and 8i further demonstrate that symmetry in the high-frequency band remains relatively strong. Notably, at 0.82 THz, as shown in Figure 8g, the transmittance consistently remains below 0.1. At this frequency, transmittance is less sensitive to changes in angle, allowing for the maintenance of a stable low transmittance mode. When the absolute value of the angle exceeds 40°, a stable low transmittance region emerges within the 0.8-1.08 THz band, exhibiting minimal dependence on the rotation angle. Figure 9 illustrates a double-layer structure at a 45-degree angle. Regarding the modulation capability of terahertz waves, the rotation direction depicted in Figure 7b demonstrates superior regulation of these waves. The results presented in Figures 9b and 9e indicate that, near the mid-band frequency of 0.5 THz, the transmittance behavior of terahertz waves exhibits rotational symmetry centered at 90 degrees. The positive and negative transmittance directions at 90 degrees correspond to opposing variation patterns, yet the patterns of their absolute values remain largely consistent.
The results indicate that the transmittance of terahertz waves within the 0.1–1.2 THz band can be effectively modulated by adjusting the rotation angle, as illustrated in the figure. This capability offers a practical approach for low-frequency terahertz modulation. Such a feature is particularly valuable for applications including terahertz filtering and frequency selection, as it allows for the reliable attenuation of specific frequencies without necessitating complex and precise angle adjustments.
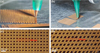 |
Fig. 1 HoFeO3 ceramic additive manufacturing. (a–b) Direct writing additive manufacturing process. (c–d) Direct write additive manufacturing results. |
 |
Fig. 2 Microstructure and Raman peaks of HoFeO3 material. (a) Microstructure of HoFeO3 sintered at 1475 °C. (b) 1500 °C. (c) 1525 °C. |
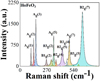 |
Fig. 3 Raman peak fitting spectra of HoFeO3. |
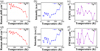 |
Fig. 4 Raman peaks with Ho vibration as the primary vibration mode: (a–c) center value, intensity, and full width at half maximum (FWHM) of Ag(1) as a function of temperature. (d–f) center value, intensity, and FWHM of Ag(2) as a function of temperature. |
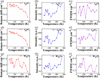 |
Fig. 5 Raman peaks with FeO6 rotation as the primary vibration mode: (a–i) show the center value, intensity, and FWHM of Ag(3), Ag(5), and B1g(2) as functions of temperature, respectively. |
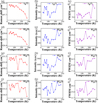 |
Fig. 6 Raman peaks with Fe-O motion as the primary vibration mode: (a–l) show the center values, intensities, and FWHM of Ag(7), B2g(5), B2g(7), and B3g(2) as functions of temperature, respectively. |
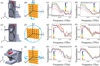 |
Fig. 7 Terahertz wave modulation structure and results. (a), (e), (i) Sample stages rotating around the X, Y, and Z axes. (b), (f), (j) Initial positions and rotation directions of the double-layer structures with a 90° included angle. (c), (g), (k) Frequency domain diagrams corresponding to the respective double-layer structures with a 90° included angle. (d), (h), (l) Frequency domain diagrams corresponding to the respective double-layer structures with a 45° included angle. |
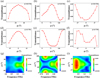 |
Fig. 8 Terahertz transmittance obtained by rotating the double-layer 90° structure around three axes. (a–c) Results in the 0.26 THz low-frequency band. (d–f) Results in the 0.5 THz mid-frequency band. (g–i) Contour plot results in the high-frequency band. |
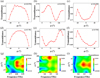 |
Fig. 9 Terahertz transmittance obtained by rotating the double-layer 45° structure around three axes. (a–c) Results in the 0.26 THz low-frequency band. (d–f) Results in the 0.5 THz mid-frequency band. (g–i) Contour plot results in the high-frequency band. |
4 Conclusions
This study investigated the variation of vibration peaks associated with the rotation of Ho and FeO6, as well as the motion of Fe-O in HoFeO3 ceramics, across a temperature range of 20 K to 300 K using variable-temperature Raman spectroscopy. The temperature-dependent changes in each mode parameter revealed phenomena such as lattice thermal expansion, softening phenomena and spin-phonon coupling. Double-layer ceramic metamaterials with angles of 90° and 45° were successfully fabricated through 3D direct ink writing additive manufacturing technology. The designed intelligent control structure and double-layer HoFeO3 ceramic structure effectively regulated terahertz waves in the 0.1–1.2 THz band. The transmittance decreased as the absolute value of the rotation angle increased. The double-layer 90° structure maintained a stable low transmittance (<0.1) at 0.82 THz and demonstrated wideband low transmittance performance within the 0.8–1.08 THz frequency range. When the double-layer 45° structure rotated in the E and H planes, it exhibited a rotationally symmetrical transmission behavior at 0.5 THz corresponding to the value of the rotation angle. This research provides a foundational design framework for the development of HoFeO3 ceramic-based terahertz modulator devices.
Funding
This study was supported by the National Natural Science Foundation of China under grants 52302132, 51788104, 51532004 and 52305334: the 9th Research Institute of China Electronics Technology Group Corporation's open projects under grant 2024SK-003-2; the Beijing Natural Science Foundation under grant L223029; the Foshan Municipal People's Government Special Fund Project for Science and Technology Innovation under grant BK22BE017; the National Key Research and Development Program of China under grants 2017YFB-0406300 and 2023YFB3506700; and the Fundamental Research Funds for the Central Universities under grants FRF06500142,FRF-BD20-08A and FRE-BD-19-003A.
Conflicts of interest
The authors have nothing to disclose.
Data availability statement
The data that support the findings of this study are available from the corresponding author upon reasonable request.
Author contribution statement
Conceptualization, Xinxi Zeng, Haoxin Sun, Peipei Li and Ji Zhou; Methodology, Yixuan Gao, Chaoyang Sun and Xian Wang; Validation, Pingfan Jia, Xiaoqing Xi, Xian Wang and Yunsheng Guo; Formal Analysis, Yixuan Gao, Haoxin Sun and Lingyun Qian; Investigation, Pingfan Jia, Haoxin Sun, Xian Wang and Yunsheng Guo; Resources, Desheng Pan, Xiaoqing Xi, Peipei Li and Pengfei Zhu; Data Curation, Pingfan Jia, Yixuan Gao, Lingyun Qian and Pengfei Zhu; Writing – Original Draft Preparation, Pingfan Jia and Haoxin Sun; Writing – Review & Editing, Xinxi Zeng, Lingyun Qian, Bo Li and Yunsheng Guo; Visualization, Yixuan Gao, Desheng Pan, Peipei Li and Bo Li; Supervision, Xinxi Zeng, Desheng Pan, Chaoyang Sun and Ji Zhou; Funding Acquisition, Xinxi Zeng and Xiaoqing Xi.
References
- Z. Wang, Y. Yao, W. Pan, H. Zhou, Y. Chen, J. Lin, J. Hao, S. Xiao, Q. He, S. Sun, Bifunctional Manipulation of Terahertz Waves with High-Efficiency Transmissive Dielectric Metasurfaces, Adv. Sci. 10, 2205499 (2023) [Google Scholar]
- X. Zeng, F. Zhang, X. Xi, H. Zhang, B. Luo, P. Zhu, G. Li, B. Li, J. Zhou, Manipulating resonances and absorptions of terahertz ferrite ceramics, Ceramics Int. 48, 27615 (2022) [Google Scholar]
- K. Amelin, U. Nagel, R. Fishman, Y. Yoshida, H. Sim, K. Park, J.-G. Park, T. Rõõm, Terahertz absorption spectroscopy study of spin waves in orthoferrite YFeO3 in a magnetic field, Phys. Rev. B 98, 174417 (2018) [Google Scholar]
- X. Li, D. Kim, Y. Liu, J. Kono, Terahertz spin dynamics in rare-earth orthoferrites, Photon. Insights 1, R05 (2023) [Google Scholar]
- X. Zeng, H. Zhang, X. Xi, B. Luo, P. Zhu, G. Li, B. Li, J. Zhou, Tuning absorption of terahertz dielectric ceramics through spin-reorientation transitions, Ceramics Int. 48, 16273 (2022) [Google Scholar]
- T.Q.H. Nguyen, H.L. Phan, J.-M. Kim, Design of reflective coding metasurface for terahertz wave beam steering for 6G technology, 2023 SBMO/IEEE MTT-S International Microwave and Optoelectronics Conference (IMOC), (IEEE, 2023), pp. 94–96 [Google Scholar]
- N. Khokhlov, A. Dolgikh, B. Ivanov, A. Kimel, Double pulse all-optical coherent control of ultrafast spin-reorientation in an antiferromagnetic rare-earth orthoferrite, APL Mater. 12, 051119 (2024) [Google Scholar]
- R. Dubrovin, E. Roginskii, V. Chernyshev, N. Novikova, M. Elistratova, I. Eliseyev, A. Smirnov, A. Brulev, K. Boldyrev, V.Y. Davydov, Lattice dynamics and mixing of polar phonons in the rare-earth orthoferrite TbFeO3, Phys. Rev. B 110, 134310 (2024) [Google Scholar]
- C. Xu, Z. Ren, J. Wei, C. Lee, Reconfigurable terahertz metamaterials: From fundamental principles to advanced 6G applications, Iscience 25, 103799 (2022) [Google Scholar]
- S. Artyukhin, M. Mostovoy, N.P. Jensen, D. Le, K. Prokes, V.G. De Paula, H.N. Bordallo, A. Maljuk, S. Landsgesell, H. Ryll, Solitonic lattice and Yukawa forces in the rare-earth orthoferrite TbFeO3, Nat. Mater. 11, 694 (2012) [Google Scholar]
- M.C. Weber, M. Guennou, H.J. Zhao, J. Íñiguez, R. Vilarinho, A. Almeida, J.A. Moreira, J. Kreisel, Raman spectroscopy of rare-earth orthoferrites R FeO3 (R= La, Sm, Eu, Gd, Tb, Dy), Phys. Rev. B 94, 214103 (2016) [Google Scholar]
- W. Anhua, Z. Xiangyang, S. Jiamin, S. Hui, S. Liangbi, Terahertz optical modulation research of rare-earth ferrite crystals, Chinese Journal of Quantum Electronics 40, 293 (2023) [Google Scholar]
- P. Vera Serna, C. García Campos, F. Sánchez De Jesús, A.M. Bolarín Miró, J.A. Juanico Lorán, J. Longwell, Mechanosynthesis, crystal structure and magnetic characterization of neodymium orthoferrite, Mater. Res. 19, 389 (2016) [Google Scholar]
- G. Jian-kui, L. Yi-jie, Z. Qin-nan, L. Bing-wei, L. Jing-bo, L. Dong-xiong, L. Run-hua, W. Dong-shan, Temperature effects on the terahertz spectral characteristics of PEEK, Spectr. Spectr. Anal. 41, 3347 (2021) [Google Scholar]
- X. Zeng, L. Wu, X. Xi, B. Li, J. Zhou, Thermally tunable terahertz magnetic responses of TbFeO3 ceramic, Ceramics Int. 44, 19054 (2018) [Google Scholar]
- T.G. Blank, K.A. Grishunin, A.V. Kimel, Magneto-optical detection of terahertz cavity magnon-polaritons in antiferromagnetic HoFeO3, Appl. Phys. Lett. 122, 072402 (2023) [Google Scholar]
- X. Zhao, G. Wang, S. Shao, Q. Meng, J. Wang, S. Zhang, B. Su, C. Zhang, Terahertz characteristics of magnetic fluid based on microfluidic technology, Int. J. Optics 2021, 5599185 (2021) [Google Scholar]
- R. Wang, W. Yang, S. Gao, X. Ju, P. Zhu, B. Li, Q. Li, Modulation of terahertz properties of 3D ceramic photonic crystals via post-creation non-metal anion doping treatment, J. Am. Ceramic Soc. 102, 4688 (2019) [Google Scholar]
- Z. Ren, L. Cheng, Z. Ma, C. Zhou, Z. Sheng, S. Guretskii, N. Liubochko, S. Barilo, J. Li, J. Shang, Terahertz spectroscopy study of doping and magnetic field induced effects on spin reorientation in Ho1-x YxFeO3 single crystals, Acta Physica Sinica 69, 207802 (2020) [Google Scholar]
- X. Zeng, R. Wang, X. Xi, B. Li, J. Zhou, 3D direct writing of terahertz metamaterials based on TbFeO3 dielectric ceramics, Appl. Phys. Lett. 113, 081901 (2018) [Google Scholar]
- R.Y. Tay, Y. Song, D.R. Yao, W. Gao, Direct-ink-writing 3D-printed bioelectronics, Mater. Today 71, 135 (2023) [Google Scholar]
- H. Gong, J. Huang, J. Wang, P. Zhao, M. Guo, C. Liang, D. Bai, Z. Jiang, R. Li, Additive manufacturing for terahertz metamaterials on the dielectric surface based on optimized electrohydrodynamic drop-on-demand printing technology, ACS Appl. Mater. Interfaces 16, 4222 (2024) [Google Scholar]
- J. Gregorio, S. Tsui, Doping-Dependent Spin Reorientation Phenomenon in Holmium-based Orthoferrite (Vibrating Sample Magnetometer Option), https://discoveryteachinglabs.com/siteDocs/EM_QD_304_01.pdf [Google Scholar]
- G. Kotnana, S.N. Jammalamadaka, Enhanced spin–reorientation temperature and origin of magnetocapacitance in HoFeO3, J. Magn. Magn. Mater. 418, 81 (2016) [Google Scholar]
- M. Adnani, M. Gooch, L. Deng, S. Agrestini, J. Herrero-Martin, H.-C. Wu, C.-K. Chang, T. Salavati-Fard, N. Poudel, J.L. García-Muñoz, Magnetocapacitance effect and magnetoelectric coupling in type-II multiferroic HoFeWO6, Phys. Rev. B 103, 094110 (2021) [Google Scholar]
- J. Yang, J. Pang, X. Luo, L. Ao, Q. Xie, X. Wang, H. Yang, X. Tang, Phase structure, bond features, and microwave dielectric characteristics of Ruddlesden–Popper type Sr2TiO4 ceramics, Materials 16, 5195 (2023) [Google Scholar]
- V.Q. Mai, N.A. Tien, low-temperature co-precipitation synthesis of HoFeO3 nanoparticles, Crystals 11, 238 (2021) [Google Scholar]
- S. Mukherjee, R. Gupta, A. Garg, Probing Magnetoelastic Coupling and Structural Changes in Magnetoelectric Gallium Ferrite, J. Phys.: Condens. Matter 23, 445403 (2011) [Google Scholar]
- M. Mączka, M. Sanjuán, A. Fuentes, L. Macalik, J. Hanuza, K. Matsuhira, Z. Hiroi, Temperature-dependent studies of the geometrically frustrated pyrochlores Ho2Ti2O7 and Dy2Ti2O7, Phys. Rev. B 79, 214437 (2009) [Google Scholar]
- Y. Yang, J. Sun, K. Zhu, Y. Liu, J. Chen, X. Xing, Raman study of BiFeO3 with different excitation wavelengths, Physica B 404, 171 (2009) [Google Scholar]
- V.S.K. Channam, Synthesis of strongly correlated oxides and investigation of their electrical and optical properties, PhD Thesis, Institut National Polytechnique de Toulouse-INPT, 2017 [Google Scholar]
- A.P.B. Selvadurai, R. Thiyagarajan, V. Pazhanivelu, R. Suriakarthick, W. Yang, R. Murugaraj, C. Venkateswaran, Metamagnetism emergence and spectroscopic elucidation of SmFeO3 nanoceramics, J. Phys. D: Appl. Phys. 52, 435002 (2019) [Google Scholar]
- R. White, R. Nemanich, C. Herring, Light scattering from magnetic excitations in orthoferrites, Phys. Rev. B 25, 1822 (1982) [Google Scholar]
- H. Schuchert, S. Hüfner, R. Faulhaber, Optical investigation of HoFeO3, Z. Phys. A 220, 280 (1969) [Google Scholar]
- Z. Fu, J. Chen, X. Chen, Y. Sun, F. Wang, J. Yang, Exploring the application of terahertz metamaterials based on metallic strip structures in detection of reverse micelles, Biosensors 14, 338 (2024) [Google Scholar]
- C. Chen, M. Chai, M. Jin, T. He, Terahertz metamaterial absorbers, Adv. Mater. Technol. 7, 2101171 (2022) [Google Scholar]
- R.G. Driggers, Encyclopedia of Optical Engineering: Las-Pho (CRC press, Hoboken, 2003), pp. 1025–2048 [Google Scholar]
- M. Born, E. Wolf, Principles of optics: electromagnetic theory of propagation, interference and diffraction of light (Elsevier, Amsterdam, 2013) [Google Scholar]
- M.N. Sadiku, S. Nelatury, Elements of electromagnetics (Oxford university press, New York, 2001) [Google Scholar]
- A. Mafi, Transverse Anderson localization of light: a tutorial review, Adv. in Opt. Photon. 7, 459 (2015) [Google Scholar]
Cite this article as: Xinxi Zeng, Pingfan Jia, Yixuan Gao, Desheng Pan, Xiaoqing Xi, Chaoyang Sun, Haoxin Sun, Xian Wang, Lingyun Qian, Peipei Li, Pengfei Zhu, Bo Li, Yunsheng Guo, Ji Zhou, HoFeO3 with Thermo-Softened phonons for 3D-printed terahertz metamaterials, EPJ Appl. Metamat. 13, 10 (2026), https://doi.org/10.1051/epjam/2026002
All Figures
|
Fig. 1 HoFeO3 ceramic additive manufacturing. (a–b) Direct writing additive manufacturing process. (c–d) Direct write additive manufacturing results. |
| In the text | |
|
Fig. 2 Microstructure and Raman peaks of HoFeO3 material. (a) Microstructure of HoFeO3 sintered at 1475 °C. (b) 1500 °C. (c) 1525 °C. |
| In the text | |
|
Fig. 3 Raman peak fitting spectra of HoFeO3. |
| In the text | |
|
Fig. 4 Raman peaks with Ho vibration as the primary vibration mode: (a–c) center value, intensity, and full width at half maximum (FWHM) of Ag(1) as a function of temperature. (d–f) center value, intensity, and FWHM of Ag(2) as a function of temperature. |
| In the text | |
|
Fig. 5 Raman peaks with FeO6 rotation as the primary vibration mode: (a–i) show the center value, intensity, and FWHM of Ag(3), Ag(5), and B1g(2) as functions of temperature, respectively. |
| In the text | |
|
Fig. 6 Raman peaks with Fe-O motion as the primary vibration mode: (a–l) show the center values, intensities, and FWHM of Ag(7), B2g(5), B2g(7), and B3g(2) as functions of temperature, respectively. |
| In the text | |
|
Fig. 7 Terahertz wave modulation structure and results. (a), (e), (i) Sample stages rotating around the X, Y, and Z axes. (b), (f), (j) Initial positions and rotation directions of the double-layer structures with a 90° included angle. (c), (g), (k) Frequency domain diagrams corresponding to the respective double-layer structures with a 90° included angle. (d), (h), (l) Frequency domain diagrams corresponding to the respective double-layer structures with a 45° included angle. |
| In the text | |
|
Fig. 8 Terahertz transmittance obtained by rotating the double-layer 90° structure around three axes. (a–c) Results in the 0.26 THz low-frequency band. (d–f) Results in the 0.5 THz mid-frequency band. (g–i) Contour plot results in the high-frequency band. |
| In the text | |
|
Fig. 9 Terahertz transmittance obtained by rotating the double-layer 45° structure around three axes. (a–c) Results in the 0.26 THz low-frequency band. (d–f) Results in the 0.5 THz mid-frequency band. (g–i) Contour plot results in the high-frequency band. |
| In the text | |
Current usage metrics show cumulative count of Article Views (full-text article views including HTML views, PDF and ePub downloads, according to the available data) and Abstracts Views on Vision4Press platform.
Data correspond to usage on the plateform after 2015. The current usage metrics is available 48-96 hours after online publication and is updated daily on week days.
Initial download of the metrics may take a while.