Fig. 3
Download original image
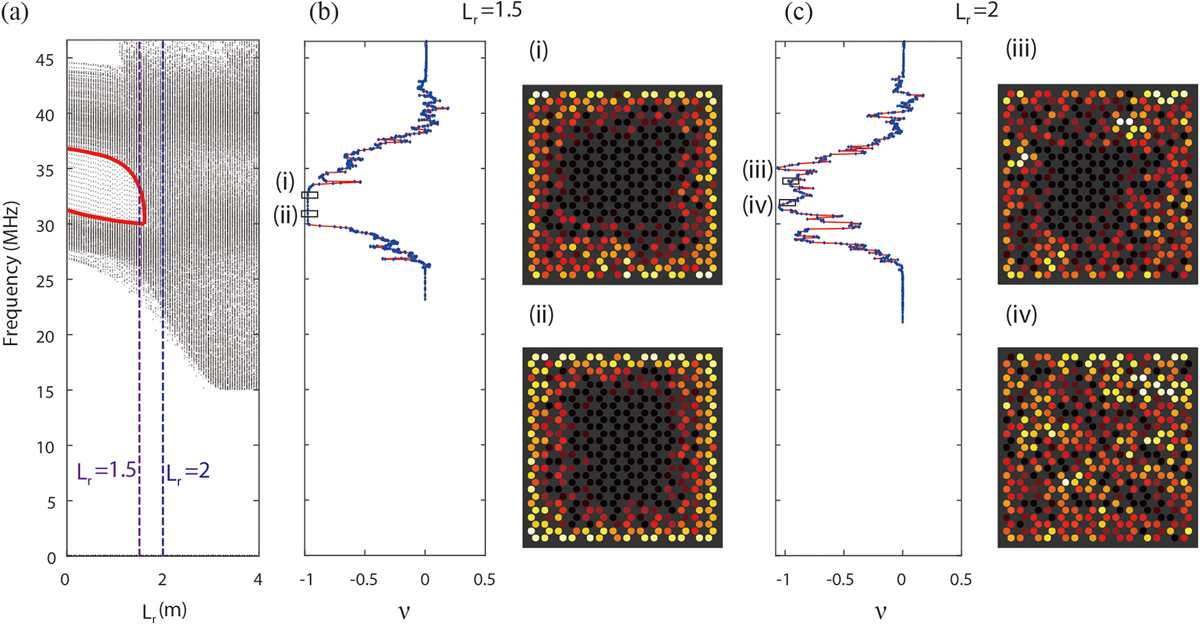
(a) Energy spectrum vs. Lr for a 13 × 13 sample. (b) The left panel is the computed local Chern numbers as a function of frequency for Lr = 1.5. The right panel shows two edge states with the frequencies marked in the left panel. (c) The left panel is the local Chern numbers for a bigger disorder of Lr = 2. The right panel shows a bulk state and an edge state, respectively.
Current usage metrics show cumulative count of Article Views (full-text article views including HTML views, PDF and ePub downloads, according to the available data) and Abstracts Views on Vision4Press platform.
Data correspond to usage on the plateform after 2015. The current usage metrics is available 48-96 hours after online publication and is updated daily on week days.
Initial download of the metrics may take a while.