| Issue |
EPJ Appl. Metamat.
Volume 13, 2026
|
|
|---|---|---|
| Article Number | 8 | |
| Number of page(s) | 17 | |
| DOI | https://doi.org/10.1051/epjam/2025012 | |
| Published online | 13 February 2026 | |
https://doi.org/10.1051/epjam/2025012
Original Article
Mirror-stacked tetra-missing rib honeycomb with persistent zero Poisson's ratio
1
School of Civil Engineering and Geomatics, Southwest Petroleum University, Chengdu 610500, PR China
2
Center for Mechanics Plus under Extreme Environments, Faculty of Mechanical Engineering & Mechanics, Ningbo University, Ningbo 315211, PR China
3
Zhejiang Key Laboratory of Intelligent Construction and Operation & Maintenance for Deep-Sea Foundations, Ningbo University of Technology, Ningbo, 315211, PR China
4
State Key Laboratory of Solidification Processing, Northwestern Polytechnical University, Xi'an 710072, PR China
* e-mails: This email address is being protected from spambots. You need JavaScript enabled to view it.
; This email address is being protected from spambots. You need JavaScript enabled to view it.
Received:
17
October
2025
Accepted:
23
November
2025
Published online: 13 February 2026
Abstract
Zero Poisson's ratio (ZPR) structures have attracted significant attention due to their remarkable dimensional stability, mechanical decoupling capability, and reduction of contact-induced effects, making them desirable in various engineering applications. However, most existing ZPR structures suffer from limited adaptability under large strains, which restricts their practical implementation. To address this challenge, this study proposes a novel ZPR design based on a mirror-stacked tetra-missing rib honeycomb (MSTMH) with monoclinic chirality. The mirror-stacked configuration effectively suppresses the Poisson's effect in the transverse direction, enabling a stable zero Poisson's ratio behavior over a wide strain range. To evaluate its performance, four MSTMH samples were fabricated using 3D printing, and uniaxial tensile tests were conducted. Finite element (FE) simulations and theoretical derivations were further employed to analyze key structural parameters, including the effective elastic modulus and ZPR strain range. The theoretical predictions show good agreement with both the experimental and numerical results. This work provides new insights and design strategies for achieving highly stable and large-deformation-tolerant ZPR metamaterials.
Key words: Zero Poisson's ratio / metamaterials / honeycomb / large deformation / chiral
© Z. Li et al., Published by EDP Sciences, 2026
 This is an Open Access article distributed under the terms of the Creative Commons Attribution License (https://creativecommons.org/licenses/by/4.0), which permits unrestricted use, distribution, and reproduction in any medium, provided the original work is properly cited.
1 Introduction
Mechanical metamaterials are engineered materials whose macroscopic mechanical properties are governed by the design of their internal geometric units, rather than their chemical composition or molecular bonding [1–6]. By tailoring the shape and spatial arrangement of microscopic structural elements [7], mechanical metamaterials can exhibit unconventional properties, including negative Poisson's ratio, zero Poisson's ratio, negative stiffness, negative thermal expansion and etc. The development of advanced fabrication techniques, such as additive manufacturing, has enabled the precise realization of complex architectures, greatly expanding the potential applications of mechanical metamaterials in various fields, such as aerospace, energy absorption, biomedical devices, and flexible electronics.
Zero Poisson's ratio (ZPR) structures are a particular class of mechanical metamaterials that maintain near-zero lateral strain under axial loading, exhibiting unique mechanical decoupling behavior [8]. These structures have reportedly been applied to aircraft skin design to ensure smooth surface morphing [9], to vibration mitigation and energy absorption due to their favorable deformation characteristics [10], and to wearable biomedical devices where lateral strain minimization is critical for comfort and performance [11]. To date, various design strategies have been proposed to achieve ZPR behavior. Early studies introduced hexagonal honeycombs [12] and semi-reentrant [13] geometries, establishing theoretical models to predict equivalent elastic moduli and Poisson's ratios. Subsequent work explored more complex architectures, including sinusoidal ligaments [14], U-shaped honeycombs [15,16], accordion-like patterns [17] and bio-inspired geometries [18,19], with theoretical modeling and finite element (FE) simulations validating their mechanical performance. Researchers have also employed optimization algorithms [20,21] to systematically tune Poisson's ratio, stiffness, and stability, while additive manufacturing has enabled the fabrication of complex graded and multi-material ZPR structures [22,23].
However, many existing ZPR structures demonstrate limited stability under large deformations, and the coupling between longitudinal and transverse directions remains insufficiently controlled, which constrains their practical applicability. Chiral-type metamaterials process a smooth transition in shape, enabling extremely large strains [24–28]. While most chiral-type structures typically exhibit a negative Poisson's ratio, the tetra-chiral structures (including classical tetra-chiral [29–31] and tetra-missing rib structures [32–35]), under specific conditions, can display a zero Poisson's ratio. Nevertheless, the tetra-chiral structure exhibits a monoclinic characteristic, in which tensile/compressive and shear deformations are inherently coupled, thereby limiting the effective strain range for achieving a zero Poisson's ratio. To overcome this limitation, this study develops a novel architecture by mirror-stacking the tetra-missing rib structure, enabling the mutual compensation of monoclinic characteristics. As a result, the proposed design exhibits a stable ZPR behavior over a wide range of large deformations. The paper is structured as follows. Section 2 presents the design methodology of the proposed structure. The mechanical response and associated deformation mechanisms under quasi-static tensile loads are examined experimentally and numerically in Section 3. Theoretical models for the elastic constants are developed in Section 4, providing guidance for optimization and practical applications. In Section 5, the strain range over which the structure can maintain a zero Poisson's ratio is further investigated. Finally, conclusions are drawn in Section 6.
2 Design methodology
As mentioned previously, the proposed MSTMH is formed by stacking two mirror-imaged tetra-missing rib elements as depicted in Figure 1. Furthermore, to achieve smoother deformation, the ligaments constituting the structure are designed with sinusoidal curves. To enhance the tunability of the structural performance, the longitudinal and transverse ligaments are designed with identical wavelengths (denoted as 2L) and wall thicknesses (denoted as t) but different amplitudes, where the longitudinal amplitude is denoted as A1 and the transverse longitudinal amplitude as A2. The out-of-plane thickness of the structure is denoted as h. Therefore, the geometry of the proposed MSTMH can be fully characterized by five geometrical parameters, i.e., L, t, A1, A2 and h.
The equation of the sinusoidal curve is expressed as
 (1)
(1)
Moreover, to avoid contact and wall intersection, the geometric parameters of the structure must satisfy the following constraints
 (2)
(2)
 (3)
(3)
For the convenience of subsequent FE simulations, a unit-cell is defined from the structure, as shown in Figure 1c. It is shown that the unit-cell can be considered as a concave quadrilateral, with each side formed by a sinusoidal curve containing half of a wavelength.
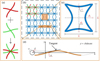 |
Fig. 1 Design methodology and geometrical description of the proposed MSTMH. |
3 Mechanical properties
This section investigates the mechanical response and the deformation mechanisms of the proposed MSTMH under quasi-static tensile loading. To balance cost and efficiency, the study primarily relies on FE simulations to assess the mechanical properties of the MSTMH, with experiments used for validation. The subsequent sections first introduce the experimental and simulation configurations.
3.1 Setup for experimental tests
The experimental specimens were fabricated using additive manufacturing (3D printing) technology (Stratasys Fortus 380). To ensure the structural stability of the 3D-printed samples and the reliability of the tests, polyamide 12 (PA12) was selected as the matrix material. To obtain the mechanical parameters of the matrix material for finite element (FE) simulations, uniaxial tensile tests were first performed on standard dumbbell-shaped specimens, which were from the same batch of material as that used in the structural tests, ensuring consistency and reliability of the experimental data.
The experiments were conducted using an electromechanical hydraulic servo testing machine (MTS 370.02, as shown in Fig. 2) at a loading rate of 1 mm/min. Force and displacement data were directly recorded from the testing machine, ensuring precise control of the experimental conditions. Data were sampled at a frequency of 100 points per second, with a loading accuracy of ±0.5%. During testing, specimen deformation was captured using a network-based area array camera (MV-CS060-10GC-PRO) at a frame rate of 1 fps. To avoid loss of deformation information throughout the test, image acquisition was synchronized with the mechanical testing. Loading conditions were continuously monitored through the control system of the MTS 370.02. The experimental setup is illustrated in Figure 2.
Four monotonic tests were performed to reduce measurement uncertainty and verify fabrication accuracy. The resulting true stress-true strain curves (Fig. 3), show excellent consistency, confirming the reliability of the experimental data. The elastic modulus, Poisson's ratio, and yield stress of the base material were determined to be 1.15 GPa, 0.35, and 35 MPa, respectively. The corresponding true stress-plastic strain data used for FE simulations are listed in Table 1.
Uniaxial tensile tests were conducted on four MSTMH specimens, each consisting of a 4×4 array of unit-cells with a thickness of 5 mm. To account for variability in the data, four sets of geometric parameters were employed, i.e., one standard set and three sets with variations in A1, t, and L, as summarized in Table 2.
The effective elastic modulus of the MSTMH can be evaluated by examining the linear region of the macroscopic stress-strain curves obtained from the experiments. In general, the horizontal and vertical strains of a specified rectangular region, as illustrated in Figure 4, can be extracted from the processed deformed images. Subsequently, the effective Poisson's ratio ( ) is computed using
 (4)
(4)
 |
Fig. 2 Experimental setup for quasi-static tensile tests. |
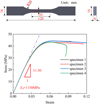 |
Fig. 3 Dimension of the specimen and experimental stress strain curves of the base material. |
Experimental true stress-plastic strain data points for the PA12.
Geometric dimensions of the experimental specimens.
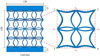 |
Fig. 4 The measurement of effective Poisson's ratios of the MSTMH. |
3.2 Setup for FE simulations
FE simulations were conducted with Abaqus/Standard to investigate the mechanical behavior of the structures under quasi-static loads. Both the finite-size (corresponding to the experimental specimens) and unit-cell-size simulations were conducted. Finite-size and unit-cell-size FE models were meshed with 8-node linear brick (C3D8) and 4-node bilinear plane stress quadrilateral (CPS4) elements, using an element size of 0.25t to guarantee a minimum of four elements through the ligament thickness. Geometric nonlinear effects were taken into account in the simulations. To eliminate boundary effects for unit-cell-size simulations, computational homogenization with periodic boundary conditions (PBCs; see Appendix A) was performed on the unit-cell.
The base material was modeled using an elastic-multilinear plastic constitutive law, with its plastic behavior specified according to Table 2.
3.3 Mechanical response and deformation mechanism
The macroscopic stress-strain curves of the four structures obtained from experimental tests and finite-size FE simulations and unit-cell-size FE simulations are given in Figure 5. The finite-size models, which fully replicate the experimental structures, show close agreement with the experiments, validating the FE modeling approach. The unit-cell-size models, constructed at the single-cell scale and subjected to periodic boundary conditions to reduce computational cost, yield results that nearly coincide with those of the finite-size models, accurately capturing the overall deformation behavior. Noted that minor local failures observed in the experiments, likely due to micro-voids, residual stresses, or other 3D printing-induced imperfections, occasionally caused interruptions in the stress-strain curves.
The effective elastic moduli determined from both experiments and simulations are presented in Figure 6. Noted that since the stress-strain curves do not exhibit a clear elastic-plastic transition, the elastic modulus is obtained by performing a linear fit over the 0.3% strain range. The results from experiments, finite-size simulations, and unit-cell-size simulations show excellent agreement, further confirming the rationality and accuracy of the finite element simulations.
Figure 7 presents the Poisson's ratios obtained from both experimental tests and FE simulations. It can be observed that the absolute values of the experimentally measured Poisson's ratios are all less than 0.12, while those obtained from simulations are approximately zero, indicating that the proposed structures exhibit an overall near-zero Poisson's ratio behavior at the macroscopic level.
To further elucidate the deformation mechanism responsible for the ZPR response, Figures 8–11 illustrate the deformation modes of the four specimens under different loading levels. As shown in these figures, the experimental observations are in good agreement with the FE simulations. During tensile deformation, only the sinusoidal ligaments aligned with the loading direction undergo noticeable local deformation, while those perpendicular to the loading direction remain almost unchanged, leading to a macroscopic near-zero Poisson's ratio. Evidently, by tuning the wavelength or amplitude of the sinusoidal ligaments, the strain range corresponding to the NPR behavior can be effectively adjusted.
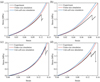 |
Fig. 5 Experimental and FE simulated macroscopic stress-strain response of (a) MSTMH-S; (b) MSTMH-A1; (c) MSTMH-t; (d) MSTMH-L. |
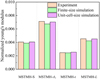 |
Fig. 6 Experimental and FE simulated elastic moduli of the MSTMH. |
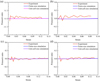 |
Fig. 7 Experimental and FE simulated Poisson's ratio evolution of (a) MSTMH-S; (b) MSTMH-A1; (c) MSTMH-t; (d) MSTMH-L. |
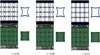 |
Fig. 8 Experimental and FE simulated Poisson's ratio deformation Profile for MSTMH-S. |
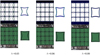 |
Fig. 9 Experimental and FE simulated Poisson's ratio deformation Profile for MSTMH-A1. |
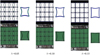 |
Fig. 10 Experimental and FE simulated Poisson's ratio deformation Profile for MSTMH-t. |
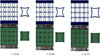 |
Fig. 11 Experimental and FE simulated Poisson's ratio deformation Profile for MSTMH-L. |
4 Theoretical modeling of the elastic constants
In this section, the elastic constants of the proposed design are theoretically derived within the framework of linear infinitesimal elasticity.
In general, the effective elastic modulus and Poisson's ratio of a conventional structural material are evaluated by subjecting the specimen to a uniaxial tensile load. Figure 12 illustrates the schematic diagram of the proposed structure under an in-plane uniaxial far-field tensile stress along the Y-direction. The corresponding free-body diagram (FBD) of a unit-cell is depicted in Figure 11b by cutting lines K1 to K4, where “1”, “2”, “3” and “4” are the external cut points of the corner of the unit-cell. All external cut points must be free of any forces in the x-direction since the macroscopic structure is stress free in the x-direction. They are subjected to normal forces in the y-direction (denoted as F), all having equal magnitudes. Further considering the twofold rotational symmetry of the geometry, each pair of corresponding external cut points of the unit cell (e.g., points “1” and “2”, points “1” and “3”, points “2” and “4” and points “3” and “4”) are subjected to identical moments, denoted as M*. Therefore, under the action of the far-field normal stress σy, the forces and moments acting on the unit-cell are detailed illustrated in Figure 11b, where F are functions of the stresses σy, i.e.,
 (5)
(5)
To facilitate the force analysis of the ligaments, half of the unit-ell is considered, as shown in Figure 11c. Points “5” and “6” correspond to the cut points of the vertical ligaments. Clearly, these two points are subjected to identical y-directional forces F and a moment M of equal magnitude but opposite directions.
Given the slender geometry of the filamentary microstructures, the Euler-Bernoulli beam theory is adopted to describe their deformations. Considering both bending and membrane effects, the strain energy of the unit-cell (denoted as U) can hence be obtained as
 (6)
(6)
where ES is the elastic modulus of the base material, S and I are the area and inertia moment of the ligament, respectively (for a rectangular cross-section with unit thickness, S = t and I = t3/12), α represents the angle formed between the tangent line at a point on the sinusoidal curve and the x-axis, as illustrated in Figure 1. Apparently, α is expressed as
 (7)
(7)
Noted that the junctions between the longitudinal and transverse ligaments can be regarded as rigid bodies, as their deformation during loading is negligible. Therefore, the lower limit of the integral in equation (6) does not start from zero but from an angle θ1, which is defined in Appendix B.
Since no relative rotation occurs between points “5” and “6” during deformation, a geometric condition must hold, i.e.,
 (8)
(8)
Substituting the strain energy from equation (6) into equation (8) gives
 (9)
(9)
We hence have
 (10)
(10)
where
 (11)
(11)
The strain energy of the unit-cell can be further rewritten as
 (12)
(12)
Based on Castigliano's second theorem, the total displacement of point “1” (“2”) relative to point “3” (“4”) in the direction of the applied force F (denoted as δ) can be obtained from the relation  , i.e.,
 (13)
(13)
The vertical longitudinal average strain ε of the unit-cell is readily obtained as
 (14)
(14)
In view of equations (5) and (11), the longitudinal effective elastic modulus  of the structure (normalized by the elastic modulus of the base material) is obtained as
 (15)
(15)
To determine the Poisson's ratio of the structure, a pair of equal and opposite virtual transverse forces should be applied at points “1” and “2” and points “3” and “4”. Since the virtual forces are applied at the corner points of the unit cell, they do not contribute to the strain energy. According to the principle of virtual work, it is therefore evident that the Poisson's ratio of the structure is zero, i.e.,
 (16)
(16)
This conclusion is consistent with the results obtained from both the FE simulations and the experimental observations presented previously.
With the expressions for the normalized effective elastic modulus established, we proceed to validate the theoretical predictions. First, the theoretical results are compared with both experimental measurements and FE simulations for the four tested specimens, as shown in Figure 13. The comparison includes results from finite-size FE models and unit-cell-size FE models. As shown in Figure 13, excellent agreement is observed among the experiments, simulations, and theoretical predictions, confirming the accuracy of the derived theoretical formulation.
Subsequently, the influence of three key geometric parameters (i.e., A1, t and L) on the normalized effective elastic modulus of the structure is investigated. For each parameter, its effect is studied while keeping the other geometric parameters constant. The variation in the effective elastic modulus predicted by the theory is then compared with unit-cell-size FE simulation results, as presented in Figure 14. The trends demonstrate that the theoretical model captures the parametric dependence of the elastic modulus with high fidelity, further validating the applicability of the derived expressions for structural design and optimization. As the ligament thickness t increases, the normalized effective elastic modulus increases accordingly, since the stiffness of the ligaments is enhanced. In contrast, an increase in the amplitude A1 leads to a decrease in the normalized effective elastic modulus, as the ligaments become more flexible. Similarly, increasing the ligament length L results in a reduction of the normalized effective elastic modulus, due to the corresponding decrease in the relative density of the structure, which lowers the overall stiffness.
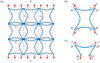 |
Fig. 12 (a) Schematic diagram of the MSTMH under uniaxial load; (b) the related free-body diagram of a unit-cell; (c) the related free-body diagram of half of a unit-cell. |
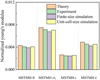 |
Fig. 13 The effective elastic modulus of the MSTMH obtained from the theoretical formulation, the experimental tests, the finite-size FE calculations, and the unit-cell-size FE calculations. |
 |
Fig. 14 Theoretical (lines) and FE (symbols) of the normalized effective elastic modulus of the MSTMH over a range of (a) A1 (A2=3, t=1.5, L=30), (b) t (A1=8, A2=3, L=30) and (c) L (A1=8, A2=3, t=1.5). |
5 ZPR strain range
Recall that the primary motivation of the proposed design is to achieve a structure exhibiting ZPR over a large deformation range. Therefore, understanding the strain range within which the structure maintains this behavior (denoted as ZPR strain range, εR) is of significant importance.
It should be noted that while experimental validation was performed in earlier sections, the analysis of the ZPR strain range in this section relies primarily on FE simulations. This choice is due to limitations of the current 3D printing process, which causes premature failure of the printed specimens making it difficult to experimentally investigate the ZPR strain range. Therefore, in this section, we further investigate this aspect primarily through FE analysis. Additionally, to better observe the potential transformation of deformation modes, the FE simulations conducted in this section employ 201 stainless steel as the base material, which exhibits a more typical elastic-plastic transition. The material properties are referenced from the work of Yang et al. [36].
A detailed examination of the deformation mechanism, as illustrated in Figure 15, reveals that the structural deformation can be divided into two distinct stages. In the first stage (stage-I), the curvature of the longitudinal sinusoidal ligaments is gradually straightened, and local bending deformations dominate the overall structural response. Since the ligaments overlap only at a single central point, the deformation of one set of ligaments transmits negligible force to the orthogonal set. Consequently, the two principal directions remain effectively kinematically decoupled, and the transverse ligaments exhibit almost no lateral expansion or contraction until the curved ligaments are nearly straightened. This decoupling mechanism allows the structure to maintain a ZPR response throughout stage I. Once the longitudinal sinusoidal ligaments are fully straightened, the deformation enters the second stage (stage-II), dominated by axial stretching. At this point, the axial forces in the longitudinal ligaments are transmitted to the transverse ligaments through the junction regions. It should be noted that even in Stage II, the simulated Poisson's ratio remains close to zero. However, it is important to point out that the simulations don't account for damage in the base material, which in reality would fail rapidly at this stage. Therefore, we consider the ZPR prior to the deformation mode transition to be the effective one.
Based on the deformation mechanism revealed in Figure 15, it is evident that the strain range over which the structure maintains a ZPR corresponds to the strain at which the deformation mode transitions. As illustrated in Figure 15, the vertical projection of ligament AB before deformation and at the deformation mode transition can be respectively expressed as
 (17)
(17)
 (18)
(18)
where YS is defined in Appendix B. Therefore, the ZPR strain range can be obtained as
 (19)
(19)
The derived expression for the ZPR strain range of the MSTMH is validated through unit-cell-size FE simulations, and the influence of the three key geometric parameters (A1, t, L) on the ZPR strain range is simultaneously investigated. As shown in Figure 16, the theoretical predictions agree well with the simulation results, confirming the accuracy of the theoretical formation. Furthermore, the influence of the three key geometric parameters on the ZPR strain range is further analyzed. As shown in this figure, an increase in the amplitude A1 leads to a larger ZPR strain range, since a larger A1 corresponds to greater initial curvature of the ligaments, resulting in more pronounced deformation during straightening. In contrast, increasing the ligament length L reduces the ZPR strain range, as it corresponds to a smaller curvature and thus less deformation at the onset of the mode transition. The ZPR strain range is found to be largely independent of the ligament thickness t, which is consistent with both the theoretical predictions and FE simulations.
It is noteworthy that under certain geometric configurations, the proposed structure can maintain a ZPR over a strain range exceeding 25%. This demonstrates the capability of the proposed structure to accommodate large deformations while preserving near-zero Poisson's ratio behavior, making the design promising for applications requiring large-strain, multi-functional mechanical metamaterials.
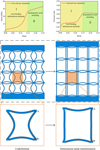 |
Fig. 15 Two-stage deformation of the MSTMH and its effect on zero Poisson's ratio. |
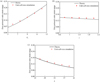 |
Fig. 16 Theoretical (lines) and FE (symbols) of the ZPR strain range of the MSTMH over a range of (a) A1 (A2=3, t=1.5, L=30), (b) t (A1=8, A2=3, L=30) and (c) L (A1=8, A2=3, t=1.5). |
6 Conclusions
In this study, a mirror-stacked tetra-missing rib honeycomb structure with sinusoidal ligaments was proposed and systematically analyzed. Theoretical derivations, FE simulations, and experiments consistently demonstrated that the structure exhibits near-zero Poisson's ratio behavior in large strain range and allows tunable elastic properties. The major findings from this study can be summarized as follows:
The proposed structure exhibits excellent ZPR behavior over a large deformation range. In some cases, the strain range maintaining ZPR exceeds 25%.
The proposed theoretical formulae accurately capture the evolution of the elastic constants with geometric variations and the ZPR strain range, thereby providing valuable guidelines for the design of novel ZPR metamaterials to achieve targeted mechanical properties.
These results provide clear design guidelines for developing multifunctional mechanical metamaterials with programmable deformation characteristics.
Funding
The financial support from the National Natural Science Foundation of China (12372143) is gratefully acknowledged.
Conflicts of interest
The authors declare that they have no conflict of interest.
Data availability statement
The data that support the findings of this study are available from the corresponding author upon reasonable request.
Author contribution statement
Zheng Li: Conceptualization, Methodology, Investigation, Numerical analysis, Writing – original draft.Zhenya Zhang: Investigation, Numerical simulations, Data curation.Xisheng Deng: Investigation, Validation, Data analysis.Yuanxi Huang: Formal analysis, Visualization.Hui Chen: Methodology, Writing – review & editing.Yilin Zhu: Conceptualization, Supervision, Project administration, Writing – review & editing.
References
- X. Yu, J. Zhou, H. Liang, Z. Jiang, L. Wu, Mechanical metamaterials associated with stiffness, rigidity and compressibility: a brief review, Prog. Mater. Sci. 94, 114 (2018) [Google Scholar]
- J.U. Surjadi, L. Gao, H. Du, X. Li, X. Xiong, N.X. Fang, Y. Lu, Mechanical metamaterials and their engineering applications, Adv. Eng. Mater. 21, 1800864 (2019) [Google Scholar]
- R. Craster, S. Guenneau, M. Kadic, M. Wegener, Mechanical metamaterials, Rep. Prog. Phys. 86, 094501 (2023) [Google Scholar]
- Y. Bai, C. Liu, Y. Li, J. Li, L. Qiao, J. Zhou, Y. Bai, Programmable mechanical metamaterials with tailorable negative Poisson's ratio and arbitrary thermal expansion in multiple thermal deformation modes, ACS Appl. Mater. Interfaces 14, 35905 (2022) [Google Scholar]
- X. Li, W. Peng, W. Wu, J. Xiong, Y. Lu, Auxetic mechanical metamaterials: from soft to stiff, Int. J. Extreme Manuf. 5, 042003 (2023) [Google Scholar]
- R. Xu, C. Chen, J. Sun, Y. He, X. Li, M. Lu, Y. Chen, The design, manufacture and application of multistable mechanical metamaterials-a state-of-the-art review, Int. J. Extreme Manuf. 5, 420 (2023) [Google Scholar]
- P. Sun, W. Yang, Y. Zhang, B. Zhang, Z. Fan, L. Li, Enhanced tensile properties of 3D printed soft-hard composites due to Poisson's ratio mismatch: Experimental and numerical study, Comp. Part B-Eng. 299, 112413 (2025) [Google Scholar]
- B.J. Sahariah, M.J. Baishya, A. Namdeo, P. Khanikar, A novel strategy to design lattice structures with zero Poisson's ratio, Eng. Struct. 288, 116214 (2023) [Google Scholar]
- X. Gong, J. Huang, F. Scarpa, Y. Liu, J. Leng, Zero Poisson's ratio cellular structure for two-dimensional morphing applications, Comp. Struct. 134, 384 (2015) [Google Scholar]
- Y. Nian, Y.-Q. Ni, M. Avcar, R. Yue, K. Zhou, Novel negative-zero-positive Poisson's ratio graded mechanical metamaterials for enhanced energy absorption: Performance investigation and design optimization, Eng. Struct. 343, 121092 (2025) [Google Scholar]
- X. Luo, K. Chen, Z. Deng, W. Luo, S. Wei, J. Zheng, X. Wu, G. Ouyang, Enhancing wearable strain sensor performance through a simple Poisson's ratio structural design, Chem. Eng. J. 518, 164802 (2025) [Google Scholar]
- K.R. Olympio, F. Gandhi, Zero Poisson's ratio cellular honeycombs for flex skins undergoing one-dimensional morphing, J. Intell. Mater. Syst. Struct. 21, 1737 (2010) [CrossRef] [Google Scholar]
- J.N. Grima, L. Oliveri, D. Attard, B. Ellul, R. Gatt, G. Cicala, G. Recca, Hexagonal honeycombs with zero Poisson's ratios and enhanced stiffness, Adv. Eng. Mater. 12, 855 (2010) [CrossRef] [Google Scholar]
- Y. Zhu, X. Wu, X. Rui, D. Gan, Q. Wang, C. Zhang, On the design and in-plane crashworthiness of a novel extendable assembled auxetic honeycomb, Thin Wall. Struct. 211, 113123 (2025) [Google Scholar]
- H. Yang, L. Ma, Multi-stable mechanical metamaterials by elastic buckling instability, J. Mater. Sci. 54, 3509 (2019) [Google Scholar]
- X. Zhang, C. Lu, R. Li, T. Xie, Study of rhombic star-shaped honeycomb with tunable Poisson's ratio and elastic modulus properties, Appl. Phys. A-Mater. 130, 1 (2024) [Google Scholar]
- L. Rong, Z. Yifeng, Z. Yilin, C. Haiwen, C. Minfang, Three-dimensional orthogonal accordion cellular structures with multi-directional zero Poisson's ratio effects, Thin Wall. Struct. 202, 112148 (2024) [Google Scholar]
- Q. Qin, I. Dayyani, P. Webb, Structural Mechanics of cylindrical fish-cell zero Poisson's ratio metamaterials, Comp. Struct. 289, 115455 (2022) [Google Scholar]
- Q. Qin, I. Dayyani, Large strain zero Poisson's ratio spring cell metamaterial with critical defect analysis and variable stiffness distributions, Comp. Struct. 318, 117102 (2023) [Google Scholar]
- A. Jha, I. Dayyani, Shape optimisation and buckling analysis of large strain zero Poisson's ratio fish-cells metamaterial for morphing structures, Comp. Struct. 268, 113995 (2021) [Google Scholar]
- X.S. Zhang, G.H. Paulino, A.S. Ramos Jr, Multimaterial topology optimization with multiple volume constraints: Combining the ZPR update with a ground‐structure algorithm to select a single material per overlapping set, Int. J. Numer. Meth. Eng. 114, 1053 (2018) [Google Scholar]
- J. Chen, X. Shen, J. Li, Zero Poisson's ratio flexible skin for potential two-dimensional wing morphing, Aerosp. Sci. Technol. 45, 228 (2015) [Google Scholar]
- R. Hamzehei, A. Zolfagharian, S. Dariushi, M. Bodaghi, 3D-printed bio-inspired zero Poisson's ratio graded metamaterials with high energy absorption performance, Smart Mater. Struct. 31, 035001 (2022) [Google Scholar]
- Y. Zhu, Z.-P. Wang, L.H. Poh, Auxetic hexachiral structures with wavy ligaments for large elasto-plastic deformation, Smart Mater. Struct. 27, 055001 (2018) [Google Scholar]
- Y. Zhu, Z. Zeng, Z.-P. Wang, L.H. Poh, Y. Shao, Hierarchical hexachiral auxetics for large elasto-plastic deformation, Mater. Res. Express 6, 085701 (2019) [Google Scholar]
- Y. Jiang, Y. Li, 3D Printed Auxetic Mechanical Metamaterial with Chiral Cells and Re-entrant Cores, Sci. Rep. 1, 2397 (2018) [Google Scholar]
- A. Pozniak, K. Wojciechowski, Poisson's ratio of rectangular anti‐chiral structures with size dispersion of circular nodes, Phys. Status Solidi B 251, 367 (2014) [Google Scholar]
- L. Mizzi, D. Attard, R. Gatt, A.A. Pozniak, K.W. Wojciechowski, J.N. Grima, Influence of translational disorder on the mechanical properties of hexachiral honeycomb systems, Comp. Part B-Eng. 80, 84 (2015) [Google Scholar]
- K. Tee, A. Spadoni, F. Scarpa, M. Ruzzene, Wave propagation in auxetic tetrachiral honeycombs, J. Vib. Acoust. 132, 031007 (2010) [Google Scholar]
- Z. Liao, Y. Wang, L. Gao, Z.-P. Wang, Deep-learning-based isogeometric inverse design for tetra-chiral auxetics, Comp. Struct. 280, 114808 (2022) [Google Scholar]
- X. Lu, V. Tan, T. Tay, Auxeticity of monoclinic tetrachiral honeycombs, Comp. Struct. 241, 112067 (2020) [Google Scholar]
- Y. Zhu, S. Jiang, Q. Zhang, J. Li, C. Yu, C. Zhang, A novel monoclinic auxetic metamaterial with tunable mechanical properties, Int. J. Mech. Sci. 236, 107750 (2022) [Google Scholar]
- X. Deng, Q. Lu, Crushing performance of a novel tetra-missing rib honeycomb: Experimental and numerical studies, J. Mech. Behav. Biomed. Mater. 151, 106410 (2024) [Google Scholar]
- F. Lu, T. Wei, C. Zhang, Y. Huang, Y. Zhu, X. Rui, A novel 3D tetra-missing rib auxetic meta-structure with tension/compression-twisting coupling effect, Thin Wall. Struct. 199, 111764 (2024) [Google Scholar]
- C.W. Smith, J. Grima, K. Evans, A novel mechanism for generating auxetic behaviour in reticulated foams: missing rib foam model, Acta Mater. 48, 4349 (2000) [Google Scholar]
- K. Yang, Q. Qin, Z. Zhai, C. Qiao, Y. Chen, J. Yang, Dynamic response of self-locked energy absorption system under impact loadings, Int. J. Impact Eng. 122, 209 (2018) [Google Scholar]
- J. Dirrenberger, S. Forest, D. Jeulin, Effective elastic properties of auxetic microstructures: anisotropy and structural applications, Int. J. Mech. Mater. Des. 9, 21 (2013) [Google Scholar]
- S. Lejeunes, S. Bourgeois, Une tool box abaqus pour le calcul de propriétés effectives de milieux hétérogènes, 10e colloque national en calcul des structures, 2011 [Google Scholar]
Cite this article as: Zheng Li, Zhenya Zhang, Xisheng Deng, Yuanxi Huang, Hui Chen, Yilin Zhu, Mirror-stacked tetra-missing rib honeycomb with persistent zero Poisson's ratio, EPJ Appl. Metamat. 13, 8 (2026), https://doi.org/10.1051/epjam/2025012
Appendix A Computational homogenization based on PBCs
To simplify the FE calculation and eliminate the boundary effects, the homogenization method based on PBCs is adopted to derive the effective properties of lattice structures. According to the work by Dirrenberger et al. [37] and Lejeunes and Bourgeois [38], the PBCs for a unit-cell in the small-deformation framework can be written as
 (A1)
(A1)
 (A2)
(A2)
where x is the material point location vector, Λ is the macroscopic strain tensor, V is the volume of a unit-cell, v is the periodic fluctuation, which takes the same value at the two points on the opposite faces of ∂V, σ is the stress tensor of an arbitrary material point, t and N are the corresponding traction vector and outward unit normal vector, respectively.
The macroscopic stress and strain tensors Σ and Λ are defined by the spatial averages of the microscopic stress and strain tensors, i.e.,
 (A3)
(A3)
 (A4)
(A4)
with σ and ε being the microscopic stress and strains tensors of an arbitrary material point.
The effective (in-plane) Poisson's ratio is hence determined by
 (A5)
(A5)
Note that an ABAQUS toolbox “HOMTOOLS” (implemented by Lejeunes and Bourgeois [38]), that greatly simplifies the determination of homogenized characteristics of structural materials, is adopted in this work to facilitate the application of PBCs. By using “HOMTOOLS”, the macroscopic stress and strain tensors Σ and Λ are introduced as reaction forces and degrees of freedom of pre-defined reference points. In addition, the constraints between the additional degrees of freedom and the displacements on the boundary of the unit-cell are automatically generated.
Appendix B Derivation of θ1
The geometric definition of the ligaments near the junction is illustrated in Figure B1. In this figure, the dashed line represents the neutral axis. To determine θ1, the value of YS must first be obtained, which in turn requires determining the value of Y′S.
 |
Fig. B1 Geometric definition of ligaments near the junction. |
The equations of the neutral axes for the transverse and longitudinal ligaments are respectively given as
 (B1)
(B1)
 (B2)
(B2)
Their corresponding derivatives are respectively given as
 (B3)
(B3)
 (B4)
(B4)
Therefore, the upper boundary equation of the transverse ligament and the right boundary equation of the longitudinal ligament are respectively obtained, i.e.,
 (B5)
(B5)
 (B6)
(B6)
By setting  , the value of X′S is determined through computational solution using the commercial software Maple. Substituting this result into the preceding expressions allows for the calculation of Y′S. Subsequently, based on geometric relationships, an explicit expression for YS can be derived.
Ultimately, θ1 is obtained according to the following relation
 (B7)
(B7)
All Tables
All Figures
|
Fig. 1 Design methodology and geometrical description of the proposed MSTMH. |
| In the text | |
|
Fig. 2 Experimental setup for quasi-static tensile tests. |
| In the text | |
|
Fig. 3 Dimension of the specimen and experimental stress strain curves of the base material. |
| In the text | |
|
Fig. 4 The measurement of effective Poisson's ratios of the MSTMH. |
| In the text | |
|
Fig. 5 Experimental and FE simulated macroscopic stress-strain response of (a) MSTMH-S; (b) MSTMH-A1; (c) MSTMH-t; (d) MSTMH-L. |
| In the text | |
|
Fig. 6 Experimental and FE simulated elastic moduli of the MSTMH. |
| In the text | |
|
Fig. 7 Experimental and FE simulated Poisson's ratio evolution of (a) MSTMH-S; (b) MSTMH-A1; (c) MSTMH-t; (d) MSTMH-L. |
| In the text | |
|
Fig. 8 Experimental and FE simulated Poisson's ratio deformation Profile for MSTMH-S. |
| In the text | |
|
Fig. 9 Experimental and FE simulated Poisson's ratio deformation Profile for MSTMH-A1. |
| In the text | |
|
Fig. 10 Experimental and FE simulated Poisson's ratio deformation Profile for MSTMH-t. |
| In the text | |
|
Fig. 11 Experimental and FE simulated Poisson's ratio deformation Profile for MSTMH-L. |
| In the text | |
|
Fig. 12 (a) Schematic diagram of the MSTMH under uniaxial load; (b) the related free-body diagram of a unit-cell; (c) the related free-body diagram of half of a unit-cell. |
| In the text | |
|
Fig. 13 The effective elastic modulus of the MSTMH obtained from the theoretical formulation, the experimental tests, the finite-size FE calculations, and the unit-cell-size FE calculations. |
| In the text | |
|
Fig. 14 Theoretical (lines) and FE (symbols) of the normalized effective elastic modulus of the MSTMH over a range of (a) A1 (A2=3, t=1.5, L=30), (b) t (A1=8, A2=3, L=30) and (c) L (A1=8, A2=3, t=1.5). |
| In the text | |
|
Fig. 15 Two-stage deformation of the MSTMH and its effect on zero Poisson's ratio. |
| In the text | |
|
Fig. 16 Theoretical (lines) and FE (symbols) of the ZPR strain range of the MSTMH over a range of (a) A1 (A2=3, t=1.5, L=30), (b) t (A1=8, A2=3, L=30) and (c) L (A1=8, A2=3, t=1.5). |
| In the text | |
|
Fig. B1 Geometric definition of ligaments near the junction. |
| In the text | |
Current usage metrics show cumulative count of Article Views (full-text article views including HTML views, PDF and ePub downloads, according to the available data) and Abstracts Views on Vision4Press platform.
Data correspond to usage on the plateform after 2015. The current usage metrics is available 48-96 hours after online publication and is updated daily on week days.
Initial download of the metrics may take a while.