Fig. 9
Download original image
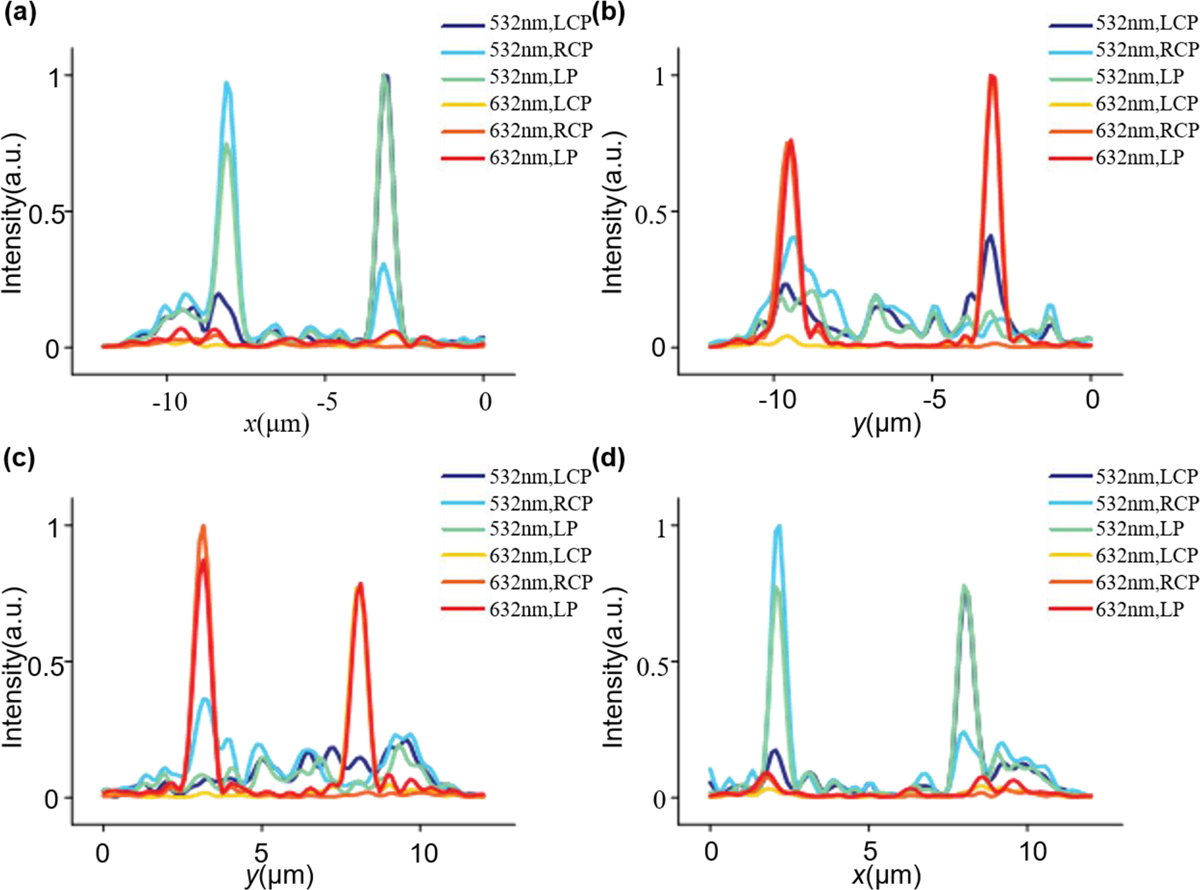
The simulation results of the electric field intensity distribution along the x or y direction of each region of the dual-wavelength metalens. (a) The intensity distribution along the x direction in R1. (b) The intensity distribution along the y direction in R2. (c) The intensity distribution along the y direction in R3. (d) The intensity distribution along the x direction in R4.
Current usage metrics show cumulative count of Article Views (full-text article views including HTML views, PDF and ePub downloads, according to the available data) and Abstracts Views on Vision4Press platform.
Data correspond to usage on the plateform after 2015. The current usage metrics is available 48-96 hours after online publication and is updated daily on week days.
Initial download of the metrics may take a while.