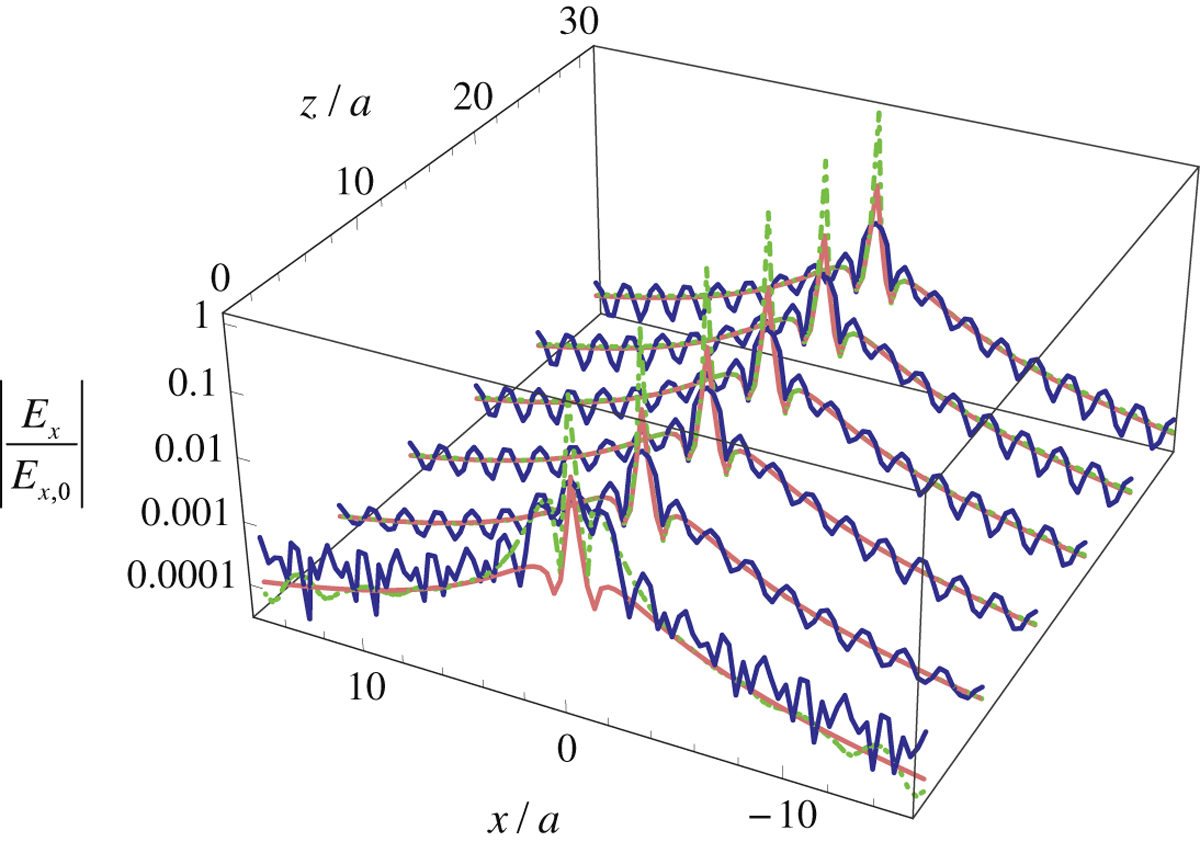
Figure 3.
Download original image
Field profile of Ex as a function of x and for different positions along z-direction. Pink solid curves: contribution of the TEM mode with no spatial cut-off equation (13); green dot-dashed curves: numerical result calculated with equation (15) with the integration range {kx, ky} ∈ (−∞, +∞); blue solid curves: numerical result calculated with equation (15) with the integration range {kx, ky} ∈ [−π/a, π/a]. The structural parameters are the same as in Figure 2.
Current usage metrics show cumulative count of Article Views (full-text article views including HTML views, PDF and ePub downloads, according to the available data) and Abstracts Views on Vision4Press platform.
Data correspond to usage on the plateform after 2015. The current usage metrics is available 48-96 hours after online publication and is updated daily on week days.
Initial download of the metrics may take a while.