Open Access
Figure 3.
Download original image
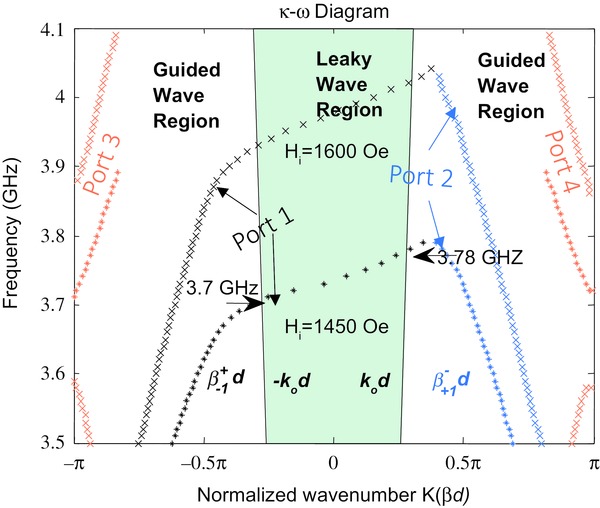
Dispersion diagram of the coupled microstrip lines unit-cell in Figure 2. Calculations refer to Hi = 1450 Oe (indicated with *) and 1600 Oe (indicated with ×).
Current usage metrics show cumulative count of Article Views (full-text article views including HTML views, PDF and ePub downloads, according to the available data) and Abstracts Views on Vision4Press platform.
Data correspond to usage on the plateform after 2015. The current usage metrics is available 48-96 hours after online publication and is updated daily on week days.
Initial download of the metrics may take a while.