Open Access
Figure 13.
Download original image
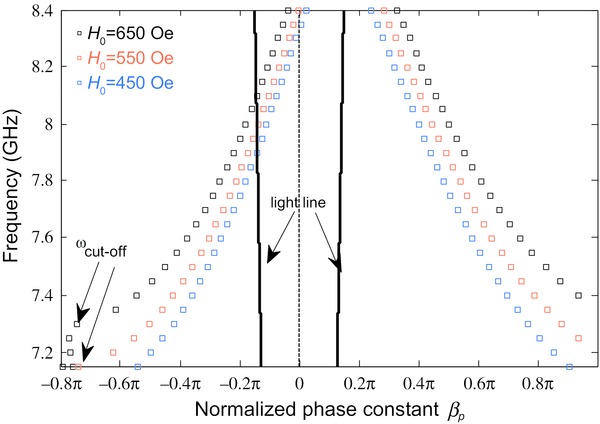
Dispersion curves of the unit-cell design in Figure 12 calculated for 3 different bias field strengths, H0 = 450, 550, 650 Oe. Tunability of the dispersion curves is limited because the operation frequency is far away from the ferromagnetic resonance of the YIG substrate.
Current usage metrics show cumulative count of Article Views (full-text article views including HTML views, PDF and ePub downloads, according to the available data) and Abstracts Views on Vision4Press platform.
Data correspond to usage on the plateform after 2015. The current usage metrics is available 48-96 hours after online publication and is updated daily on week days.
Initial download of the metrics may take a while.