Fig. 5
Download original image
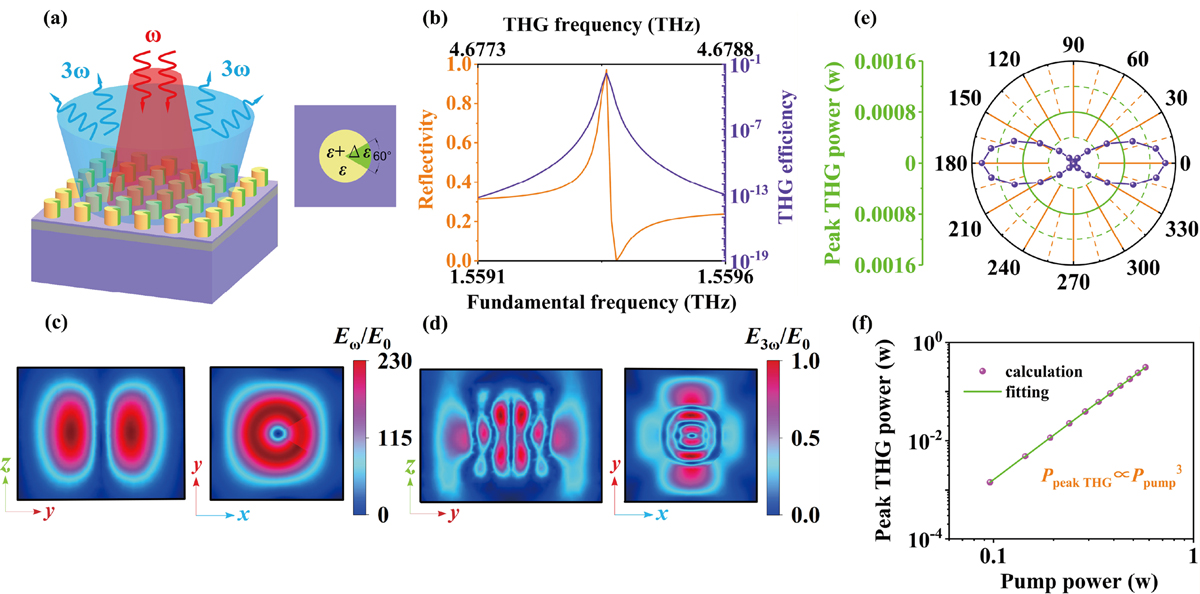
(a) Schematic illustration of dielectric constant perturbation and enhanced THG. (b, c) The electric field distributions of the FF and TH on the unit cell cross-section under QBIC resonance frequency. (c) Relationship between the reflection spectrum and THG conversion efficiency as a function of pump light frequency near the QBIC resonance frequency. (e) The dependence of THG power on the polarization angle of pump light. (f) The double-logarithmic plot of THG power versus FF pump power. The fitting curve confirming the cubic relationship of TH optical effect.
Current usage metrics show cumulative count of Article Views (full-text article views including HTML views, PDF and ePub downloads, according to the available data) and Abstracts Views on Vision4Press platform.
Data correspond to usage on the plateform after 2015. The current usage metrics is available 48-96 hours after online publication and is updated daily on week days.
Initial download of the metrics may take a while.