Fig. 3
Download original image
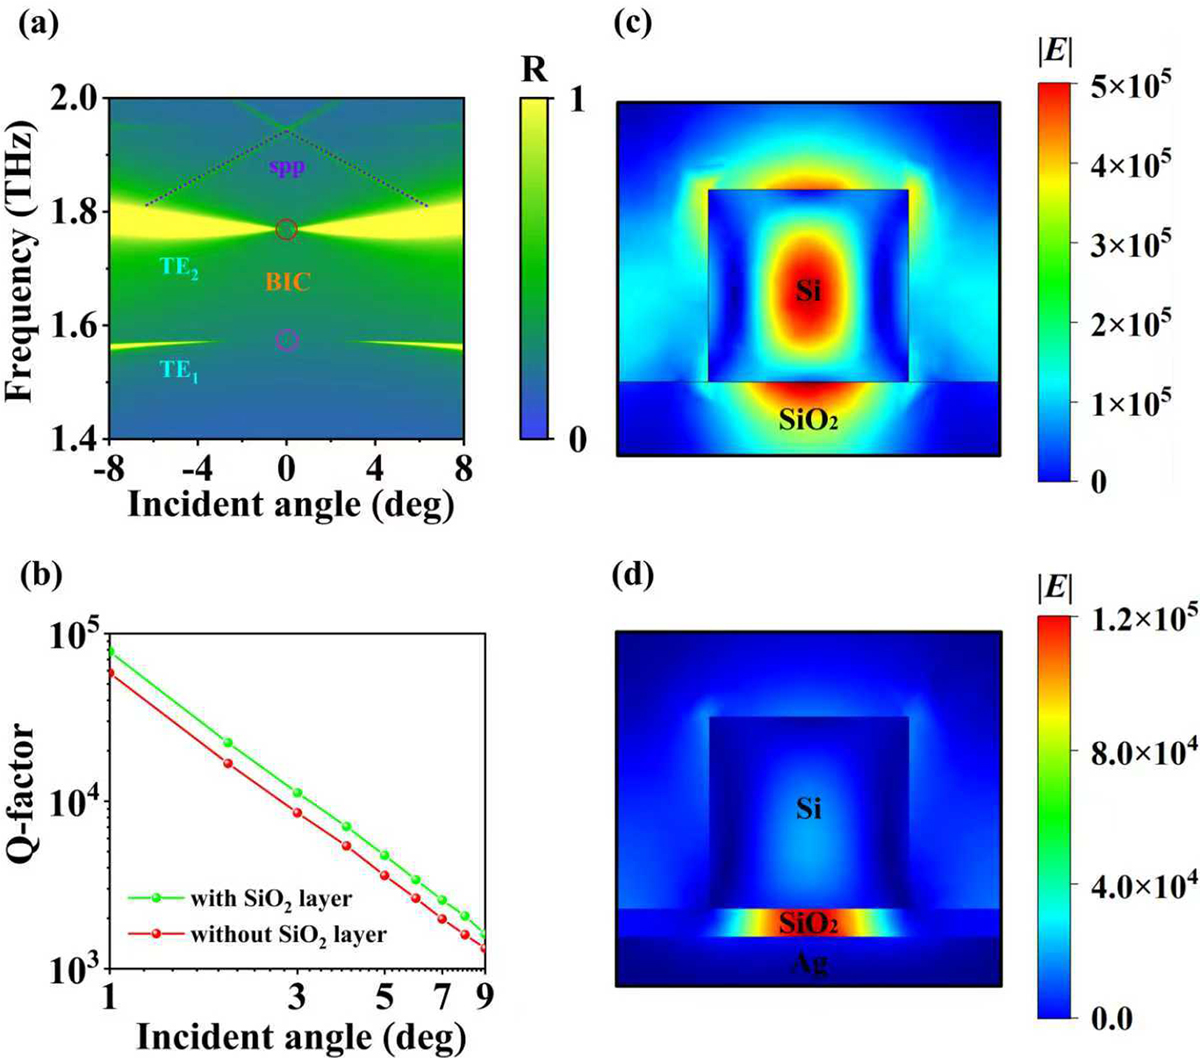
(a) 2D color map of reflectivity as a function of frequency and incident angle. Pink and red circles indicate the positions of SP-BIC, and purple points represent SPPs. (b) Q factors of QBIC as a function of incident angle for the hybrid structure (green) and the plasmonic structure (red). (c) Electric field distribution of the BIC in the x-z plane under the TE1 mode in the hybrid THz-MS. (d) Electric field distribution of the BIC in the x-z plane under the TE2 mode in the hybrid THz-MS.
Current usage metrics show cumulative count of Article Views (full-text article views including HTML views, PDF and ePub downloads, according to the available data) and Abstracts Views on Vision4Press platform.
Data correspond to usage on the plateform after 2015. The current usage metrics is available 48-96 hours after online publication and is updated daily on week days.
Initial download of the metrics may take a while.