Fig. 2
Download original image
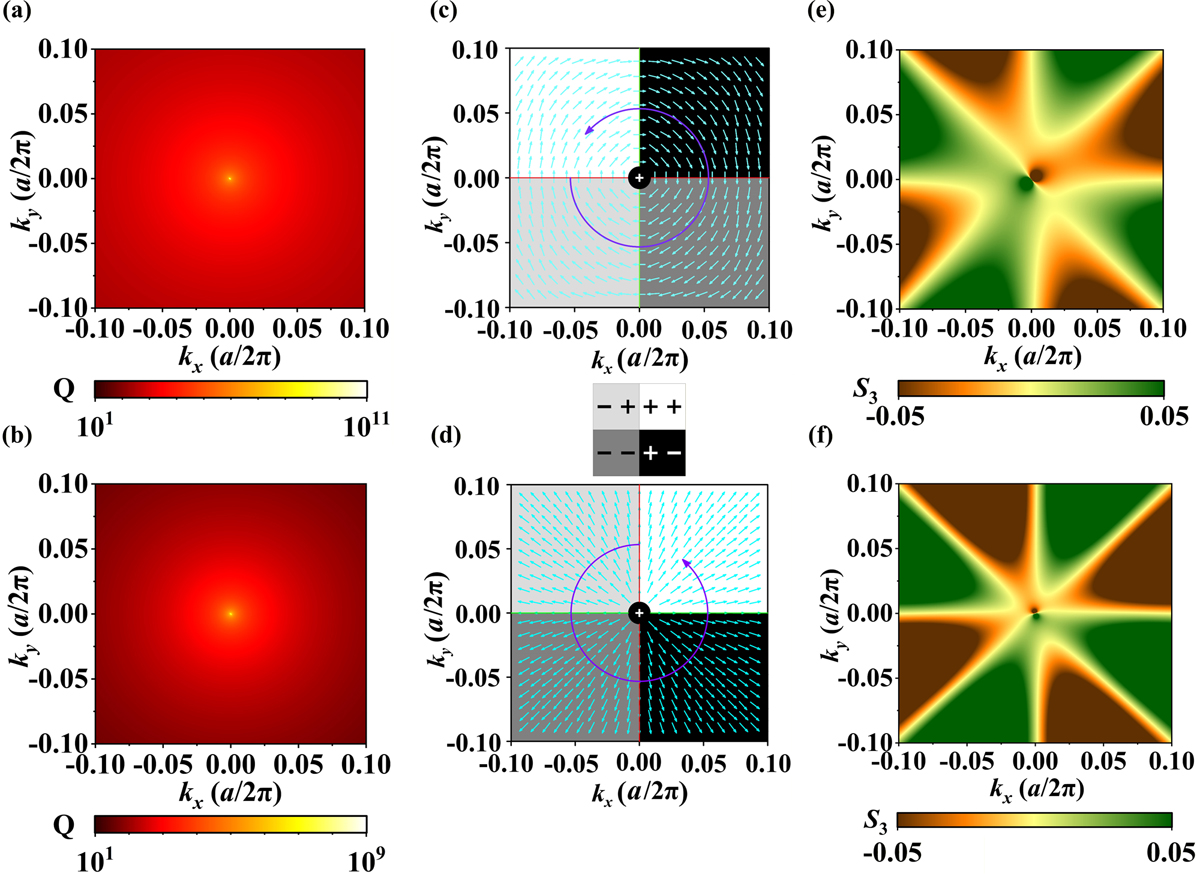
(a, b) 2D Q factor maps for the TE1 and TE2 bands. The color hues denote the Q factors of the eigenmodes. (c, d) Polarization vector distributions of the TE1 and TE2 eigenmodes that showcases a topological charge of q = 1. The red line represents Cx = 0, the green line represents Cy = 0, the cyan arrows indicate the direction of the polarization vector, and the purple ring shows the variation trend of the polarization vector direction. (e, f) Stokes parameter S3 distributions of the TE1 and TE2 modes
Current usage metrics show cumulative count of Article Views (full-text article views including HTML views, PDF and ePub downloads, according to the available data) and Abstracts Views on Vision4Press platform.
Data correspond to usage on the plateform after 2015. The current usage metrics is available 48-96 hours after online publication and is updated daily on week days.
Initial download of the metrics may take a while.