Fig. 4
Download original image
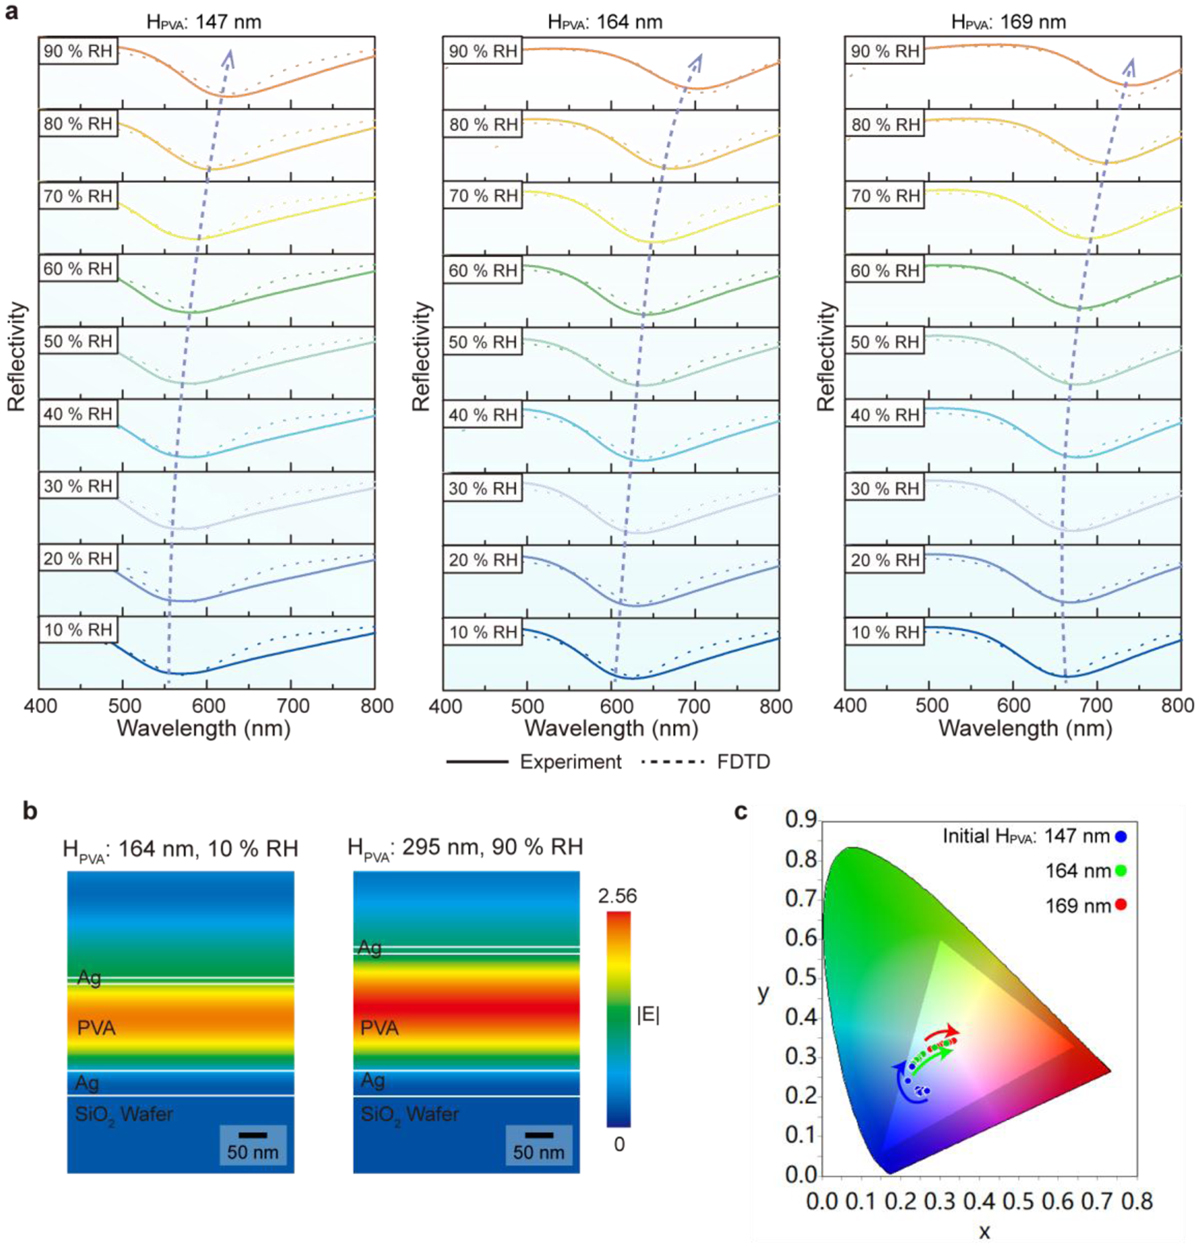
(a) Experimental and simulated reflection spectra at stepwise increasing ambient humidity from 10 to 90% RH. (b) The simulated electric-field distribution for MHM nanocavity with the initial HPVA of 164 nm at 10% RH and fully-swelled HPVA of 295 nm at 90% RH. (c) CIE 1931 diagram of the real-time color change of MHM nanocavities between 10% and 90% RH. HPVA values for (a) and (c) are selected as 147, 164 and 169 nm, respectively.
Current usage metrics show cumulative count of Article Views (full-text article views including HTML views, PDF and ePub downloads, according to the available data) and Abstracts Views on Vision4Press platform.
Data correspond to usage on the plateform after 2015. The current usage metrics is available 48-96 hours after online publication and is updated daily on week days.
Initial download of the metrics may take a while.