| Issue |
EPJ Appl. Metamat.
Volume 7, 2020
Frontiers in microwave, photonic, and mechanical metamaterials
|
|
|---|---|---|
| Article Number | 11 | |
| Number of page(s) | 8 | |
| DOI | https://doi.org/10.1051/epjam/2020015 | |
| Published online | 19 January 2021 | |
https://doi.org/10.1051/epjam/2020015
Research article
Hyperbolic dispersion metamaterials and metasurfaces
1
Department of Physics, University of Calabria, Via P. Bucci, Rende, CS 87036, Italy
2
CNR NANOTEC-Istituto di Nanotecnologia, UOS Cosenza, Rende, CS 87036, Italy
3
Centre for Disruptive Photonic Technologies, The Photonic Institute, Nanyang Technological University, 637371 Singapore
4
Department of Physics, Case Western Reserve University, 10600 Euclid Avenue, Cleveland, OH 44106, USA
* e-mail: This email address is being protected from spambots. You need JavaScript enabled to view it.
Received:
29
October
2020
Accepted:
20
December
2020
Published online: 19 January 2021
Abstract
In recent years a wide interest has been spurred by the inverse design of artificial materials for nano-biophotonic applications. In particular, the extreme optical properties of artificial hyperbolic dispersion nanomaterials allowed to access new physical effects and mechanisms. The unbound isofrequency surfaces of hyperbolic metamaterials and metasurfaces allow to access virtually infinite photonic density of states, ultrahigh confinement of electromagnetic fields and anomalous wave propagation. Here, we report the most relevant physical properties of different hyperbolic dispersion material geometries and how they allow to control light-matter interaction at the single nanometer scale, in biological matter.
Key words: Metasurfaces / metamaterials / hyperbolic dispersion / biosensing
© G. Palermo et al., published by EDP Sciences, 2021
 This is an Open Access article distributed under the terms of the Creative Commons Attribution License (https://creativecommons.org/licenses/by/4.0), which permits unrestricted use, distribution, and reproduction in any medium, provided the original work is properly cited.
1 Introduction
In recent years, plasmonic and dielectric metasurfaces have received a great deal of interest because of the tremendous potential of these deeply subwavelength nano-patterned surfaces in several technological realms. Metasurfaces allow wavefront engineering, local phase and amplitude control of light along the surface by using dielectric or plasmonic resonators [1–4]. At the same time, plasmonic materials represent the next generation nanomaterials with enormous potential to transform healthcare by providing advanced sensors, [5,6] imaging devices, [7,8] and therapies, [9–11] as well as to advance energy-relevant materials, [12,13] such as bio-antennae and light harvesting systems.
Hyperbolic metamaterials (HMMs) are a class of artificial anisotropic materials, which originates from the concept of optics of crystals [14–16]. HMM shows hyperbolic dispersion because the out of plane dielectric component ϵzz = ϵ⊥ has an opposite sign to the in-plane dielectric components ϵxx = ϵyy = ϵ||. As it is known, homogenous isotropic materials exhibit spherical dispersion, with the dispersion relation  . However, uniaxial anisotropic materials such as HMMs have a hyperbolic dispersion relation
  , where the dielectric response is given by the tensor ϵ = [ϵxx, ϵyy, ϵzz]. This hyperbolic dispersion allows these materials to support waves with infinitely large momentum (bulk plasmon polaritons, BPPs) in the effective medium limit. These waves can propagate inside HMMs, but are evanescent and decay away exponentially in the superstrate. Since the BPP modes are non-radiative with high momentum, they can only be excited using a momentum coupler such as a prism [17] or grating [18], just like in the case of surface plasmon polaritons. It has been shown that the BPP modes of both type I (ϵ|| > 0, ϵ⊥ < 0) and type II (ϵ|| < 0, ϵ⊥ > 0) HMMs can be excited using either coupling technique and the excited modes showed high quality (Q) factor resonances [18].
Since HMMs support high Q-factor multimode BPP resonances, they can be used to develop ultra-sensitive multimode biosensors.
However, extreme sensitivity biosensing is only possible by exciting the BPP modes of the HMMs. A Type II HMM supports only high-k BPP modes, whereas a Type I HMM supports both high-k and low-k BPP modes.
More recently, various HMM-based ultra-sensitive biosensors using different interrogation schemes have been proposed for non-invasive liquid biopsies. This article highlights our recent advances in hyperbolic dispersion metasurface based biosensor technology, and in particular discusses reconfigurable biosensors based on Type I and Type II HMMs.
2 Results and discussion
2.1 Prism coupled HMM-based tunable biosensor
The development of a tunable Type I HMM and excitation of BPP modes via prism coupling has been demonstrated. The enhanced sensing is demonstrated by using the Goos-Hänchen (G-H) shift interrogation scheme [19]. The G-H shift describes the lateral displacement of the reflected beam from the interface of two media when the angles of incidence are close to the coupling angle [20].
In order to develop a low-loss tunable HMM, 10 alternating thin layers of a low-loss plasmonic material such as TiN (16 nm) and a low-loss phase change material such as Sb2S3 (25 nm) are deposited on a glass substrate. The optical properties of the developed HMM can be tuned by switching the structural phase of Sb2S3 from amorphous to crystalline. In Figure 1a, the EMT derived uniaxial permittivity components of Sb2S3-TiN HMM have been shown when Sb2S3 is in amorphous and crystalline phases. As can be seen, Sb2S3-TiN HMM exhibits Type I hyperbolic dispersion at λ ≥ 580 nm when Sb2S3 is in amorphous phase. However, the operating wavelength of Type I region is slightly blue shifted to 564 nm after the crystallization of Sb2S3 layers in the HMM.
To excite the BPP modes of Sb2S3-TiN HMM through prism coupling, an He-Ne laser (632.8 nm) with TM polarized light was used as the excitation source. This wavelength belongs to the hyperbolic region of the HMM and the effective index of HMM is less than that of the used BK7 prism index (1.5), so that the momentum matching condition can be satisfied. In Figure 1b, the excited BPP mode of Sb2S3-TiN HMM has been plotted, when Sb2S3 is in both phases. After switching the phase of Sb2S3 from amorphous to crystalline state, the effective index of the HMM decreased, as a result (i) the minimum reflected intensity at the resonance angle declined, (ii) the linewidth of the reflection spectrum decreased and (iii) the coupling angle slightly shifted.
At resonance, the estimated propagating mode nearest in momentum is 13.08 μm−1 with a propagation length of 177 nm. It appears that the excited mode is the fundamental BPP mode of Sb2S3-TiN HMM, but it is a low-k mode. It is known that the phase difference between TM and TE polarized light experiences a sharp singularity at the coupling angle [21]. Thus, as shown in Figure 1c, this phase difference can be actively tuned by switching the phase of Sb2S3 from amorphous to crystalline.
Since the phase derivative at the coupling angle determines the magnitude of the G-H shift, an enhanced and tunable G-H shift at the BPP mode excitation angle can be realized using the Sb2S3-TiN HMM. As shown in Figure 1d, the maximum G-H shift is obtained at the coupling angle where there is a sharp change of phase difference. In addition, a tunable G-H shift is possible by switching the phase of Sb2S3 in the HMM from amorphous to crystalline. To validate this tunable behavior experimentally, refractive index sensing has been performed since the G-H shift strongly depends on the superstrate refractive index. A differential phase-sensitive setup to record the GH shifts has been used [20–22]. In the experiments, the G-H shifts have been monitored, by injecting different weight ratios (1–10% w/v) of aqueous solutions of glycerol with known refractive indices into sensor channel. The real time refractive index sensing data is presented in Figure 1e, where measured G-H shift change with time due to the refractive index change of glycerol solutions has been report. It is evident that a clear step function in G-H shift by varying the glycerol concentration is obtained. More importantly, a tunable G-H shift is obtained by switching the Sb2S3 structural phase from amorphous to crystalline. It is clear from both calculations and experimental data that the maximum G-H shift is possible when Sb2S3 in the HMM is in the crystalline phase because the crystalline phase provides a higher phase change at the coupling angle. Therefore, the obtained maximum refractive index sensitivity for the crystalline phase of HMM results to be 13.4 × 10⁻⁷ RIU/nm. The minimum sensitivity obtained for the amorphous phase of HMM is 16.3 × 10⁻⁷ RIU/nm. Since the sensor shows tunable sensitivity, a reconfigurable sensor device can be developed for future intelligent sensing applications. Though the obtained tunable range is small, the G-H shift tunability can be further improved using longer wavelength sources and higher refractive index prisms [23,24]. Since electrostatically tunable sensors are important for real world applications, it can be developed by using bowtie type microheaters with longer and shorter electrical current pulses for forward (amorphous to crystalline) and reverse (crystalline to amorphous) switching, respectively [25–27].
 |
Fig. 1 (a) EMT derived real parts of uniaxial permittivity components of Sb2S3-TiN HMM when Sb2S3 is in the amorphous and crystalline phases. (b) Excited BPP mode of Sb2S3-TiN HMM for both phases of Sb2S3. (c) Calculated phase difference between TM and TE polarization for both phases of Sb2S3. (d) Calculated tunable GH shift of the HMM. (e) Real time tunable refractive index sensing by injecting different weight percentage concentrations of glycerol in distilled water. |
2.2 Type II HMM-based biosensor
In this section, the excitation of BPP modes of Type II HMMs using grating coupling and its application for the development of biosensors with differential sensitivity is reported. Wavelength and angular interrogation schemes to demonstrate the extreme sensitivity of the biosensor for small molecule detection at low analyte concentrations have been investigated [28,29]. The HMM-based plasmonic biosensor platform, with integrated microfluidics, is illustrated in Figures 2a and 2b. As can be seen, it is a combination of a plasmonic metasurface and an HMM. The HMM consists of 16 alternating thin layers of gold and aluminum dioxide (Al2O3) with thickness 16 and 30 nm, respectively. The fabricated multilayer is a Type II HMM, which shows hyperbolic dispersion at λ ≥ 520 nm, where the real parts of parallel and perpendicular permittivity components are negative and positive, respectively (Fig. 2c). In order to excite the BPP modes of Au-Al2O3 HMM, the grating coupling technique has been used [30,31]. For this purpose, a 2D sub-wavelength Au diffraction grating with period 500 nm and hole dimeter 160 nm was integrated with the HMM (inset of Fig. 2a).
The proposed metasurface grating coupled HMM (GC-HMM) based sensor works based on the coupling condition between the metasurface grating modes and BPP modes [32,33]. The coupling condition alters when the refractive index of the surrounding medium changes, which allows to measure a change in resonance wavelength and resonance angle. Explicitly, the grating coupling condition is given by kSPP = n0 k0 sin θ ± mkg, where θ is the incident grazing angle, n0 is the refractive index of surrounding medium, k0 = 2π/λ is the vacuum wavevector, m is the grating diffraction order and kg = 2π/Λ is the grating wavevector with Λ being the grating period.
To show the BPP modes of the Au-Al2O3 HMM, the reflectance spectra of the GC-HMM with varying incidence angle, have been acquired using a variable angle high-resolution spectroscopic ellipsometer. The Q factors of these modes are remarkably high due to strong mode confinement and large modal indices. In Figure 2d, the spectral response of the fabricated sensor at different angles of incidence have been shown. The narrow modes recorded at wavelengths above 500 nm represent highly confined fundamental and higher order BPP modes of the HMM. The Q-factors of the modes measured at resonance wavelengths 1120, 755 and 580 nm are 29.5, 26 and 23, respectively. The sensor supports many modes with different Q-factors, which increases with increasing mode resonance wavelength.
The performance of the HMM-based sensor using spectral and angular interrogation schemes have been analyzed. The detection limit of the sensor has been first determined by injecting different weight ratios of aqueous solutions of glycerol into the sensor microchannel (sample volume = 1.4 μl). In Figures 2e and 2f, the reflectance spectra of the sensor with varying concentrations of glycerol in distilled water (0.1–0.5% w/v) have been shown, using spectral and angular scans, respectively. It is evident from Figure 2e that the resonance wavelength corresponding to each BPP mode red shifts and the quality factor of each mode declines with increasing glycerol concentration. In the angular scan, a positive angular shift is obtained when the glycerol weight ratio is increased (Fig. 2f). The sensor can record extremely small refractive index changes of glycerol concentrations in both scans. For example, a significant shift of 12 nm is obtained at 1300 nm even with 0.1% w/v glycerol concentration. It should be noted that the shift increases when the spectral position of the BPP mode varies from visible to NIR wavelengths because the transverse decay of the field in the superstrate strongly varies from one mode to another. Thus the sensor provides different sensitivities as the resonance wavelength increases from visible to NIR wavelengths due to the differential response of the BPP modes. The measured maximum bulk refractive index sensitivity for the longest wavelength BPP mode in spectral and angular scans is around 30 000 nm/RIU and 2500 degree/RIU, respectively. The minimum sensitivity is recorded at the shortest wavelength BPP mode, which is 13 333 nm/RIU and 2333 degree/RIU for spectral and angular scans, respectively. In addition, the sensor exhibits different FOM for each BPP mode, which are 206, 357, 535 and 590 at 550, 660, 880, and 1300 nm, respectively. It is worth noting that the recorded FOMs of the proposed multilayered HMM-based sensor are much higher than existing plasmonic biosensors. In contrast to Type I HMM based sensor [34], the proposed multilayered Type II HMM based sensor demonstrates the detection of 10 pM biotin in PBS, which shows that sensitivity is increased by six orders of magnitude [29,35].
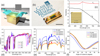 |
Fig. 2 (a) A schematic diagram of the fabricated GC-HMM based sensor device and an SEM image of the 2D subwavelength Au diffraction grating on top the HMM. (b) A photograph of the sensor device. Scale bar = 10 mm. (c) Calculated real parts of effective permittivity for an HMM consisting of eight pairs of gold/Al2O3 layers determined using effective media theory. (d) Excited BPP modes of the GC-HMM at different angles of incidence. (e–f) Standard sensor calibration tests, injecting different weight percentages of glycerol (0.1–0.5 % w/v), using wavelength interrogation (e) and angular interrogation (f). |
2.3 Biomolecular sensing at the interface between chiral metasurfaces and type II HMMs
The interface between a chiral metasurface and hyperbolic metamaterials can enable both high sensitivity and specificity for low molecular weight nucleic acids and proteins [36–40]. Interestingly, an adapted out-of-plane chiral metasurface enables three key functionalities of the HMM sensor: (i) an efficient diffractive element to excite surface and bulk plasmon polaritons; [32,41] (ii) an increase in the total sensing surface enabled via out-of-plane binding, improving diffusion-limited detection of small analyte concentrations; (iii) additional biorecognition assays via circular dichroism and chiral selectivity that can be optimally tailored to amplify the chiral-chiral interactions between the metamaterial inclusions and the molecules, enabling high-sensitivity handedness detection of enantiomers [42–46].
A sketch of a chiral metasurface hypergrating (CMH), consisting of a periodic array of right-handed Au helices on a type II HMM composed by indium tin oxide (ITO − 20 nm) and silver (Ag − 20 nm) is shown in Figure 3a. From top to bottom the geometry consists of a superstrate containing the Au helices, the multi-layer system (grey stack of ITO/Ag) and the glass substrate. The reflectance and transmittance curves are calculated for a TM polarized light and an incident angle θi = 50∘ with respect to the helix axes. This is done by solving the frequency-domain partial differential equation (PDE) that governs the E and H fields associated with the electromagnetic wave propagating through the structure [47]. As shown in Figure 3b, for the calculated reflectance for the CMH-HMM it is possible to distinguish three minima at 635 nm (mode A), 710 nm (mode B) and 890 nm (mode C), corresponding to different BPP modes of the underlying HMM, while the transmittance remains zero in the entire spectral region. The sensitivity of the sensing platform can be evaluated as a function of the analyte concentration binding at the chiral metasurface. To this end different molar fractions of an aqueous solution of 1,2,3-propantriol, characterized by an ultra low molecular weight (C3 H8 O3 ≈ 60 Da) [48], have been considered. Figure 3b shows the calculated reflection spectra of the CMH-HMM sensor in measuring 1,2,3-propantriol solutions with different concentrations. As expected, the calculated reflectance minima (mode dips) of the coupled system linearly shift towards longer wavelengths with the increase of refractive index − from 1.333 (water) to 1.401 (molar fraction of C3 H8 O3 of about 17%). The corresponding limit of detection (LOD) is equal to 1.5 × 10⁻⁴ RIU.
An important aspect of the 3D chiral metasurface is the significant increase of the out-of-plane sensing surface, since the specific binding of the analytes can occur on the entire helical surface. At the same time, a chiral structure can modify the fluid dynamics around it, inducing an increase of the probability of specific binding.
Clearly, the wavelength shift of BPP modes is strongly related to the quantity of molecules that bind selectively on the surface of the helices. It is possible to quantify this effect by considering different surface coverage of the helix, by considering the maximum RI change equals to 0.068. Coverage was varied from 0% to 100%, where in the latter case the whole surface of the helix is totally covered by molecules; here a maximum spectral shift of 15 nm for mode A, 21 nm for mode B and 31 nm for mode C have been obtained, as seen in Figure 3c. The minimum detectable surface coverage, necessary to have an appreciable shift of all three modes, is about 16%, whereas for the most sensitive mode (C) alone it is approximately 12%.
The sensitivity of the CMH-HMM sensor is also strongly affected by the distance of the bond analyte from the HMM surface. In particular, the local change of refractive index in a small disk surrounding the helix produces appreciable shifts even when the binding is confined exclusively to the upper region of the helix, which represents the maximum distance from the HMM. In Figure 3d a small disk, with n = 1.401 and corresponding to an adsorbed surface of 20%, is positioned at different distances (D) with respect to the surface of the HMM. By plotting the resonance shift of the three modes A, B and C as a function of the distance D normalized to the helix height (h) it is possible to see that the proposed biosensing platform is able to detect a shift of the considered modes even in the worst case (D/h = 1). For this case the shift is about 1.3 nm for the mode A, 4.0 nm for the mode B and 4.5 nm for the mode C, as reported in Figure 3d. These results highlight the advantages of having a metasurface to promote the detection of target analytes away from the surface of the HMM, exploiting the increased surface/volume ratio of the 3D CMH exposed to the analytes.
On the other hand, considering the intrinsic chirality of the nanohelices, CMH could excite new BPP modes of the HMM by coupling with their circular polarization dependent plasmon modes. Indeed, as reported in Figure 4a, different reflectance dips are obtained for left-handed circular polarized (LCP) and right-handed circular polarized (RCP) light. In particular, the reflectance dips obtained for LCP light, indicated in the figure as BPP3 to BPP6, are strongly related to a coupling between the plasmonic modes of the gold helix array and the HMM as reported in Figure 4b.
From the the chiroptical response of the CMH it is possible to calculate the circular dichroism (CD) signal, such as bipolar peaks and crossing points, as seen in Figure 4c. These signatures allow for increased sensitivity and accuracy when monitoring refractive index changes due to the analyte absorption. This sensing modality offers strong optical contrast even in the presence of highly achiral absorbing media, increasing the signal-to-noise CD measurements of a chiral analyte, relevant for complex biological media with limited transmission [49]. For this purpose, the reflectance curves obtained for LCP and RCP light at θi = 75∘ are used to calculate the reflectance circular dichroism (RCD) spectra, which characterizes the reflectance difference between LCP and RCP light, leading to an RCD amplitude (RCD = RLCP − RRCP). As expected, the RCD spectra for the CMH-HMM exhibit multiple features: different maxima, minima and crossing points (Fig. 4c) that are strongly affected by the refractive index variation (from 1.333 to 1.401).
It is possible to distinguish in the range 700–900 nm a minimum (λm), a crossing point (λ0) and a maximum (λM) respectively at 797, 816 and 852 nm which significantly shift and modify their intensity as the refractive index changes. These signals show a chiral plasmon (CP) sensitivity SCP = Δλ/Δn of 412 nm/RIU for λm, 485 nm/RIU for λ0 and 471 nm/RIU for λM, respectively. After extracting the classical full-width at half-maximum (FWHM) for the λm and λM modes and the FWHM in the |RCD| spectrum for λ0, the FOM, defined as FOM = SCP/FWHM [50], has been calculated. The corresponding FOM values are 18, 20 and 30. The scientific significance of chiral metasurfaces coupled with HMM nanostructures for biosensing lies in the synergistic functionalities which arise from chiral geometries and optical selectivity. This will have important implication in developing next generation biosensors for gene-protein recognition.
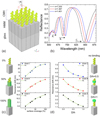 |
Fig. 3 (a) Unit cell of the CMH-HMM simulated geometry. (b) Calculated TM-polarization reflectance spectra of an Au helix array on the HMM, with water as the surrounding medium, and angle of incidence θi = 50∘. The spectrum for pure water is shown in black, while red and blue curves correspond to two different mole fractions of 1,2,3-propantriol in distilled water. (c) Sketches of the simulated geometry with different percentages of the helix surfaces covered by bound analytes, and the corresponding resonance wavelength shift for the BPP modes as a function of the surface coverage. (d) Sketch of the geometry and resonance wavelength shift for mode A, B and C with surface coverage of 20%, but with all analytes bound within a narrow disk at different distances D away from the HMM surface. D is normalized relative to the helix height h. |
 |
Fig. 4 (a) Reflectance curves of the CMH-HMM for LCP and RCP light, with angle of incidence θi = 75∘. (b) Modal dispersion curves of the HMM, with red triangles indicating BPP modes (BPP3 through BPP6) excited by circular polarized light. (c) Reflectance circular dichroism (RCD) versus wavelength at different refractive indices of the surrounding medium. |
3 Conclusions
In this article we discussed the major physical aspects characterizing hyperbolic dispersion materials. Both Type I and Type II HMMs have demonstrated to support extremely sensitive optical modes that can be used to develop cost-effective, non-invasive liquid biopsies for point-of-care (POC) clinical evaluation, early cancer screening and real-time diagnosis of diseases. This includes biosensors using different coupling mechanisms and interrogation schemes. The development of optical devices based on radically new metasurfaces holds the promise to deliver an unprecedented detection limit with an optimal dynamic range for proteomic-genomic tests.
Acknowledgments
G.P. acknowledges support from the “AIM: Attraction and International Mobility” − PON R&I 2014-2020 Calabria. Authors thank N. Maccaferri, G. E. Lio, F. De Angelis and M. Hinczewski for the fruitful discussions.
Author contribution statement
G.P. and K.V.S. contributed equally to this work.
References
- P. Genevet, F. Capasso, F. Aieta, M. Khorasaninejad, R. Devlin, Optica 4, 139 (2017) [CrossRef] [Google Scholar]
- S.M. Kamali, E. Arbabi, A. Arbabi, A. Faraon, Nanophotonics 7, 1041 (2018) [CrossRef] [Google Scholar]
- S.S. Bukhari, J.Y. Vardaxoglou, W. Whittow, Appl. Sci. 9, 2727 (2019) [CrossRef] [Google Scholar]
- A. De Luca, R. Dhama, A. Rashed, C. Coutant, S. Ravaine, P. Barois, M. Infusino, G. Strangi, Appl. Phys. Lett. 104, 103103 (2014) [CrossRef] [Google Scholar]
- B. Sepúlveda, P.C. Angelomé, L.M. Lechuga, L.M. Liz-Marzán, Nano Today 4, 244 (2009) [CrossRef] [Google Scholar]
- A. Boltasseva, H.A. Atwater, Science 331, 290 (2011) [CrossRef] [PubMed] [Google Scholar]
- X. Chen, L. Huang, H. Mühlenbernd, G. Li, B. Bai, Q. Tan, G. Jin, C.W. Qiu, S. Zhang, T. Zentgraf, Nat. Commun. 3, 1 (2012) [Google Scholar]
- K.A. Willets, A.J. Wilson, V. Sundaresan, P.B. Joshi, Chem. Rev. 117, 7538 (2017) [CrossRef] [Google Scholar]
- X. Huang, P.K. Jain, I.H. El-Sayed, M.A. El-Sayed, Lasers Med. Sci. 23, 217 (2008) [CrossRef] [Google Scholar]
- B. Nasseri, M. Turk, K. Kosemehmetoglu, M. Kaya, E. Piskin, N. Rabiee, T.J. Webster, Int. J. Nanomed. 15, 2903 (2020) [CrossRef] [Google Scholar]
- L. Ricciardi, L. Sancey, G. Palermo, R. Termine, A. De Luca, E.I. Szerb, I. Aiello, M. Ghedini, G. Strangi, M. La Deda, Nanoscale 9, 19279 (2017) [CrossRef] [Google Scholar]
- M. Khan, H. Idriss, Wiley Interdiscip. Rev. Energy Environ. 6, e254 (2017) [CrossRef] [Google Scholar]
- S. Manchala, L.R. Nagappagari, S.M. Venkatakrishnan, V. Shanker, ACS Appl. Nano Mater. 2, 4782 (2019) [CrossRef] [Google Scholar]
- A. Poddubny, I. Iorsh, P. Belov, Y. Kivshar, Nat. Photonics 7, 948 (2013) [CrossRef] [Google Scholar]
- L. Ferrari, C. Wu, D. Lepage, X. Zhang, Z. Liu, Prog. Quantum Electron. 40, 1 (2015) [CrossRef] [Google Scholar]
- P. Huo, S. Zhang, Y. Liang, Y. Lu, T. Xu, Adv. Opt. Mater. 7, 1801616 (2019) [CrossRef] [Google Scholar]
- I. Avrutsky, I. Salakhutdinov, J. Elser, V. Podolskiy, Phys. Rev. B 75, 241402 (2007) [CrossRef] [Google Scholar]
- K.V. Sreekanth, A. De Luca, G. Strangi, Sci. Rep. 3, 3291 (2013) [CrossRef] [Google Scholar]
- K.V. Sreekanth, Q. Ouyang, S. Sreejith, S. Zeng, W. Lishu, E. Ilker, W. Dong, M. ElKabbash, Y. Ting, C.T. Lim et al., Adv. Opt. Mater. 7, 1900081 (2019) [CrossRef] [Google Scholar]
- K.V. Sreekanth, Q. Ouyang, S. Han, K.T. Yong, R. Singh, Appl. Phys. Lett. 112, 161109 (2018) [CrossRef] [Google Scholar]
- K.V. Sreekanth, S. Sreejith, S. Han, A. Mishra, X. Chen, H. Sun, C.T. Lim, R. Singh, Nat. Commun. 9, 369 (2018) [CrossRef] [Google Scholar]
- K.V. Sreekanth, W. Dong, Q. Ouyang, S. Sreejith, M. ElKabbash, C.T. Lim, G. Strangi, K.T. Yong, R.E. Simpson, R. Singh, ACS Appl. Mater. Interfaces 10, 34991 (2018) [CrossRef] [Google Scholar]
- K. Boriachek, M.N. Islam, A. Möller, C. Salomon, N.T. Nguyen, M.S.A. Hossain, Y. Yamauchi, M.J. Shiddiky, Small 14, 1702153 (2018) [CrossRef] [Google Scholar]
- T. Huang, C.X. Deng, Int. J. Biol. Sci. 15, 1 (2019) [CrossRef] [Google Scholar]
- W. Dong, H. Liu, J.K. Behera, L. Lu, R.J. Ng, K.V. Sreekanth, X. Zhou, J.K. Yang, R.E. Simpson, Adv. Funct. Mater. 29, 1806181 (2019) [CrossRef] [Google Scholar]
- H. Taghinejad, S. Abdollahramezani, A.A. Eftekhar, T. Fan, A.H. Hosseinnia, O. Hemmatyar, A.E. Dorche, A. Gallmon, A. Adibi, arXiv:2003.04097 (2020) [Google Scholar]
- Y. Zhang, C. Fowler, J. Liang, B. Azhar, M.Y. Shalaginov, S. An, J.B. Chou, C.M. Roberts, V. Liberman, M. Kang et al., arXiv:2008.06659 (2020) [Google Scholar]
- G. Luka, A. Ahmadi, H. Najjaran, E. Alocilja, M. DeRosa, K. Wolthers, A. Malki, H. Aziz, A. Althani, M. Hoorfar, Sensors 15, 30011 (2015) [CrossRef] [Google Scholar]
- K.V. Sreekanth, M. ElKabbash, Y. Alapan, E.I. Ilker, M. Hinczewski, U.A. Gurkan, G. Strangi, EPJ Appl. Metamat. 4, 1 (2017) [CrossRef] [EDP Sciences] [Google Scholar]
- K. Sreekanth, A. De Luca, G. Strangi, J. Opt. 16, 105103 (2014) [CrossRef] [Google Scholar]
- K.V. Sreekanth, K.H. Krishna, A. De Luca, G. Strangi, Sci. Rep. 4, 6340 (2014) [CrossRef] [Google Scholar]
- S. Thongrattanasiri, V.A. Podolskiy, Opt. Lett. 34, 890 (2009) [CrossRef] [Google Scholar]
- S. Zeng, D. Baillargeat, H.P. Ho, K.T. Yong, Chem. Soc. Rev. 43, 3426 (2014) [CrossRef] [Google Scholar]
- A. Kabashin, P. Evans, S. Pastkovsky, W. Hendren, G. Wurtz, R. Atkinson, R. Pollard, V. Podolskiy, A. Zayats, Nat. Mater. 8, 867 (2009) [CrossRef] [PubMed] [Google Scholar]
- K.V. Sreekanth, Y. Alapan, M. ElKabbash, E. Ilker, M. Hinczewski, U.A. Gurkan, A. De Luca, G. Strangi, Nat. Mater. 15, 621 (2016) [CrossRef] [Google Scholar]
- M. Esposito, V. Tasco, M. Cuscuna, F. Todisco, A. Benedetti, I. Tarantini, M.D. Giorgi, D. Sanvitto, A. Passaseo, ACS Photonics 2, 105 (2015) [CrossRef] [Google Scholar]
- M. Esposito, V. Tasco, F. Todisco, M. Cuscunà, A. Benedetti, M. Scuderi, G. Nicotra, A. Passaseo, Nano Lett. 16, 5823 (2016) [CrossRef] [Google Scholar]
- J. Rho, X. Zhang, in Workshop on Optical Plasmonic Materials (Optical Society of America, 2014), pp. OW4D–1 [CrossRef] [Google Scholar]
- F. Li, T. Tang, J. Li, L. Luo, C. Li, J. Shen, J. Yao, J. Alloys Compd. 826, 154174 (2020) [CrossRef] [Google Scholar]
- O. Kotov, Y.E. Lozovik, Phys. Rev. B 96, 235403 (2017) [CrossRef] [Google Scholar]
- G. Palermo, G.E. Lio, M. Esposito, L. Ricciardi, M. Manoccio, V. Tasco, A. Passaseo, A. De Luca, G. Strangi, ACS Appl. Mater. Interfaces 12, 30181 (2020) [CrossRef] [Google Scholar]
- Y. Zhao, A.N. Askarpour, L. Sun, J. Shi, X. Li, A. Alù, Nat. Commun. 8, 14180 (2017) [CrossRef] [Google Scholar]
- Z. Wang, Y. Wang, G. Adamo, B.H. Teh, Q.Y.S. Wu, J. Teng, H. Sun, Adv. Opt. Mater. 4, 883 (2016) [CrossRef] [Google Scholar]
- M.L. Solomon, J. Hu, M. Lawrence, A. Garca-Etxarri, J.A. Dionne, ACS Photonics 6, 43 (2018) [CrossRef] [Google Scholar]
- E. Yashima, K. Maeda, T. Nishimura, Chem. A Eur. J. 10, 42 (2004) [CrossRef] [Google Scholar]
- J.T. Collins, C. Kuppe, D.C. Hooper, C. Sibilia, M. Centini, V.K. Valev, Adv. Opt. Mater. 5, 1700182 (2017) [CrossRef] [Google Scholar]
- G.E. Lio, G. Palermo, R. Caputo, A. De Luca, RSC Adv. 9, 21429 (2019) [CrossRef] [Google Scholar]
- F. Koohyar, F. Kiani, S. Sharifi, M. Sharifirad, S.H. Rahmanpour, Res. J. Appl. Sci. Eng. Technol. 4, 3095 (2012) [Google Scholar]
- H.H. Jeong, A.G. Mark, M. Alarcón-Correa, I. Kim, P. Oswald, T.C. Lee, P. Fischer, Nat. Commun. 7, 11331 (2016) [CrossRef] [Google Scholar]
- K.M. Mayer, J.H. Hafner, Chem. Rev. 111, 3828 (2011) [CrossRef] [PubMed] [Google Scholar]
Cite this article as: Giovanna Palermo, Kandammathe Valiyaveedu Sreekanth, Giuseppe Strangi, Hyperbolic dispersion metamaterials and metasurfaces, EPJ Appl. Metamat. 7, 11 (2020)
All Figures
|
Fig. 1 (a) EMT derived real parts of uniaxial permittivity components of Sb2S3-TiN HMM when Sb2S3 is in the amorphous and crystalline phases. (b) Excited BPP mode of Sb2S3-TiN HMM for both phases of Sb2S3. (c) Calculated phase difference between TM and TE polarization for both phases of Sb2S3. (d) Calculated tunable GH shift of the HMM. (e) Real time tunable refractive index sensing by injecting different weight percentage concentrations of glycerol in distilled water. |
| In the text | |
|
Fig. 2 (a) A schematic diagram of the fabricated GC-HMM based sensor device and an SEM image of the 2D subwavelength Au diffraction grating on top the HMM. (b) A photograph of the sensor device. Scale bar = 10 mm. (c) Calculated real parts of effective permittivity for an HMM consisting of eight pairs of gold/Al2O3 layers determined using effective media theory. (d) Excited BPP modes of the GC-HMM at different angles of incidence. (e–f) Standard sensor calibration tests, injecting different weight percentages of glycerol (0.1–0.5 % w/v), using wavelength interrogation (e) and angular interrogation (f). |
| In the text | |
|
Fig. 3 (a) Unit cell of the CMH-HMM simulated geometry. (b) Calculated TM-polarization reflectance spectra of an Au helix array on the HMM, with water as the surrounding medium, and angle of incidence θi = 50∘. The spectrum for pure water is shown in black, while red and blue curves correspond to two different mole fractions of 1,2,3-propantriol in distilled water. (c) Sketches of the simulated geometry with different percentages of the helix surfaces covered by bound analytes, and the corresponding resonance wavelength shift for the BPP modes as a function of the surface coverage. (d) Sketch of the geometry and resonance wavelength shift for mode A, B and C with surface coverage of 20%, but with all analytes bound within a narrow disk at different distances D away from the HMM surface. D is normalized relative to the helix height h. |
| In the text | |
|
Fig. 4 (a) Reflectance curves of the CMH-HMM for LCP and RCP light, with angle of incidence θi = 75∘. (b) Modal dispersion curves of the HMM, with red triangles indicating BPP modes (BPP3 through BPP6) excited by circular polarized light. (c) Reflectance circular dichroism (RCD) versus wavelength at different refractive indices of the surrounding medium. |
| In the text | |
Current usage metrics show cumulative count of Article Views (full-text article views including HTML views, PDF and ePub downloads, according to the available data) and Abstracts Views on Vision4Press platform.
Data correspond to usage on the plateform after 2015. The current usage metrics is available 48-96 hours after online publication and is updated daily on week days.
Initial download of the metrics may take a while.